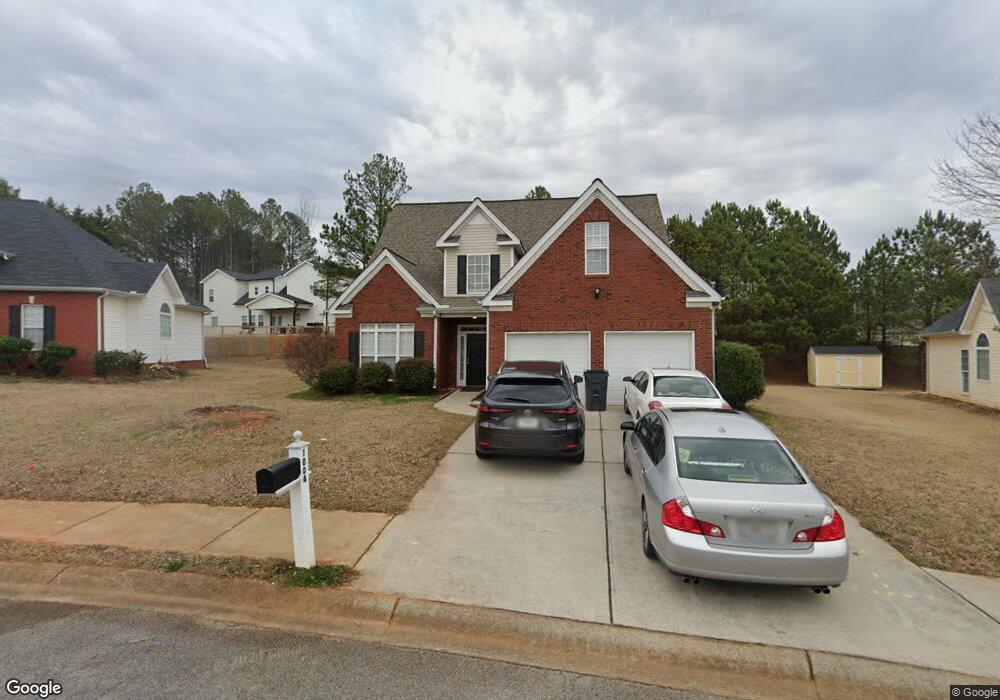
1004 E Bay Springs Dr Villa Rica, GA 30180
Estimated Value: $340,000 - $353,000
3
Beds
3
Baths
2,469
Sq Ft
$140/Sq Ft
Est. Value
About This Home
This home is located at 1004 E Bay Springs Dr, Villa Rica, GA 30180 and is currently estimated at $346,684, approximately $140 per square foot. 1004 E Bay Springs Dr is a home located in Carroll County with nearby schools including Ithica Elementary School, Bay Springs Middle School, and Villa Rica High School.
Ownership History
Date
Name
Owned For
Owner Type
Purchase Details
Closed on
Feb 21, 2020
Sold by
Progress Atlanta Llc
Bought by
Progress Residential Borrower 13 Llc
Current Estimated Value
Purchase Details
Closed on
Nov 26, 2019
Sold by
Clark Sherry
Bought by
Progress Atlanta Llc
Purchase Details
Closed on
Jun 10, 2011
Sold by
Wells Fargo Bank
Bought by
Clark Sherry
Home Financials for this Owner
Home Financials are based on the most recent Mortgage that was taken out on this home.
Original Mortgage
$54,000
Interest Rate
4.54%
Mortgage Type
New Conventional
Purchase Details
Closed on
Apr 5, 2011
Sold by
Crass Alford
Bought by
Wells Fargo Bank Na
Purchase Details
Closed on
Apr 7, 2004
Sold by
Bay Springs Dev Inc
Bought by
Crass Alford and Crass Connie L
Purchase Details
Closed on
Apr 26, 1999
Bought by
Bay Springs Dev Inc
Create a Home Valuation Report for This Property
The Home Valuation Report is an in-depth analysis detailing your home's value as well as a comparison with similar homes in the area
Home Values in the Area
Average Home Value in this Area
Purchase History
| Date | Buyer | Sale Price | Title Company |
|---|---|---|---|
| Progress Residential Borrower 13 Llc | -- | -- | |
| Progress Atlanta Llc | $183,000 | -- | |
| Clark Sherry | $90,230 | -- | |
| Wells Fargo Bank Na | $55,500 | -- | |
| Crass Alford | $165,000 | -- | |
| Bay Springs Dev Inc | -- | -- |
Source: Public Records
Mortgage History
| Date | Status | Borrower | Loan Amount |
|---|---|---|---|
| Previous Owner | Wells Fargo Bank Na | $54,000 |
Source: Public Records
Tax History Compared to Growth
Tax History
| Year | Tax Paid | Tax Assessment Tax Assessment Total Assessment is a certain percentage of the fair market value that is determined by local assessors to be the total taxable value of land and additions on the property. | Land | Improvement |
|---|---|---|---|---|
| 2024 | $4,250 | $150,660 | $7,400 | $143,260 |
| 2023 | $4,250 | $137,487 | $7,400 | $130,087 |
| 2022 | $3,211 | $102,478 | $7,400 | $95,078 |
| 2021 | $2,831 | $88,796 | $7,400 | $81,396 |
| 2020 | $2,336 | $79,296 | $7,400 | $71,896 |
| 2019 | $1,999 | $72,336 | $7,400 | $64,936 |
| 2018 | $1,816 | $63,098 | $7,400 | $55,698 |
| 2017 | $1,743 | $59,144 | $10,000 | $49,144 |
| 2016 | $1,752 | $59,144 | $10,000 | $49,144 |
| 2015 | $1,572 | $48,862 | $10,000 | $38,863 |
| 2014 | $1,262 | $39,576 | $8,000 | $31,576 |
Source: Public Records
Map
Nearby Homes
- 0 N Bay View Dr Unit 10258471
- 752 Crystal Bay Rd
- 511 Charleston Place
- 509 Charleston Place
- 507 Charleston Place
- 506 Charleston Place
- 504 Charleston Place
- 502 Charleston Place
- 500 Charleston Place
- 498 Charleston Place
- 494 Charleston Place
- 492 Charleston Place
- 245 Raleigh Way
- 490 Charleston Place
- 239 Summergate Ln
- 486 Charleston Place
- 1004 E Bay Springs Dr
- 1008 E Bay Springs Dr
- 1000 E Bay Springs Dr
- N Bay Springs
- 804 N Bay Overlook
- 808 N Bay Overlook
- N E Bay Springs Dr
- E E Bay Springs Dr
- 1012 E Bay Springs Dr
- 938 Center Bay Dr
- 1005 E Bay Springs Dr
- 161 N Bay View Dr
- 1001 E Bay Springs Dr
- 812 N Bay Overlook
- 800 N Bay Overlook
- 151 N Bay View Dr
- 1013 E Bay Springs Dr
- 934 Center Bay Dr
- 807 N Bay Overlook
- 1017 E Bay Springs Dr