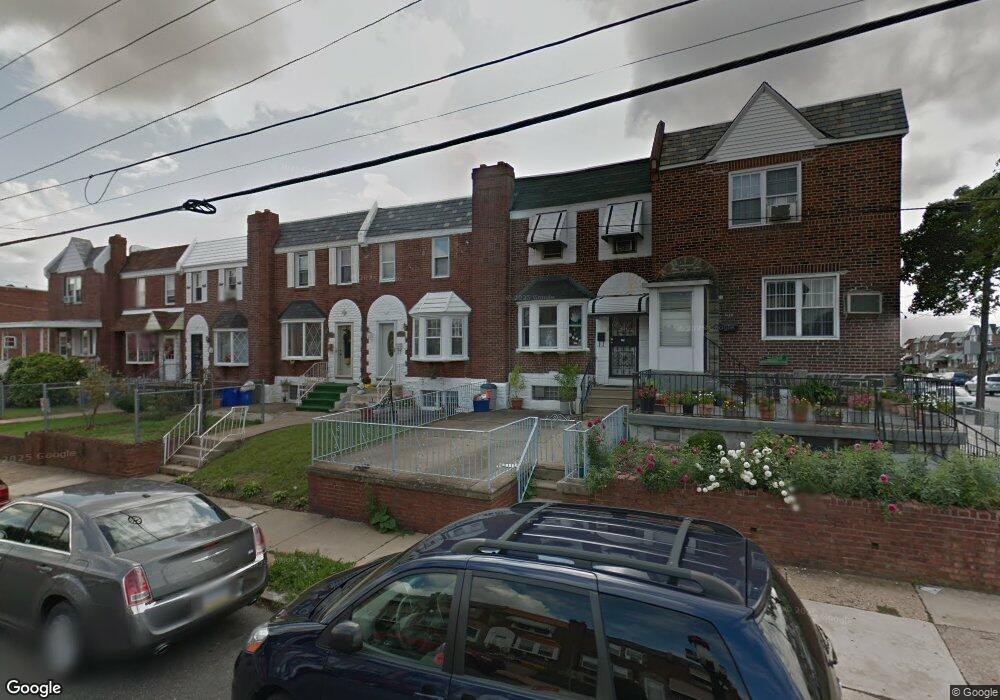
1004 E Luzerne St Philadelphia, PA 19124
Juniata Park NeighborhoodEstimated Value: $200,417 - $240,000
3
Beds
1
Bath
1,260
Sq Ft
$174/Sq Ft
Est. Value
About This Home
This home is located at 1004 E Luzerne St, Philadelphia, PA 19124 and is currently estimated at $219,104, approximately $173 per square foot. 1004 E Luzerne St is a home located in Philadelphia County with nearby schools including Frankford High School, Community Academy of Philadelphia CS, and Holy Innocents Area Catholic Elementary School.
Ownership History
Date
Name
Owned For
Owner Type
Purchase Details
Closed on
Dec 4, 2023
Sold by
Riley Lucy
Bought by
Riley Lucy and Riley Talissa Mary
Current Estimated Value
Purchase Details
Closed on
May 17, 2002
Sold by
Mahallati Joseph
Bought by
Riley Rogelio A
Home Financials for this Owner
Home Financials are based on the most recent Mortgage that was taken out on this home.
Original Mortgage
$61,514
Interest Rate
7%
Mortgage Type
FHA
Purchase Details
Closed on
May 2, 2002
Sold by
Hud
Bought by
Mahallati Joseph
Home Financials for this Owner
Home Financials are based on the most recent Mortgage that was taken out on this home.
Original Mortgage
$61,514
Interest Rate
7%
Mortgage Type
FHA
Purchase Details
Closed on
Oct 30, 2000
Sold by
Reyes Juan C and Reyes Yolanda
Bought by
Chase Mtg Company and Chemical Mtg Company
Purchase Details
Closed on
Oct 2, 2000
Sold by
Chase Mtg Company
Bought by
Hud
Create a Home Valuation Report for This Property
The Home Valuation Report is an in-depth analysis detailing your home's value as well as a comparison with similar homes in the area
Home Values in the Area
Average Home Value in this Area
Purchase History
| Date | Buyer | Sale Price | Title Company |
|---|---|---|---|
| Riley Lucy | -- | None Listed On Document | |
| Riley Rogelio A | $62,000 | -- | |
| Mahallati Joseph | $39,300 | -- | |
| Chase Mtg Company | $4,300 | -- | |
| Hud | -- | -- |
Source: Public Records
Mortgage History
| Date | Status | Borrower | Loan Amount |
|---|---|---|---|
| Previous Owner | Riley Rogelio A | $61,514 |
Source: Public Records
Tax History Compared to Growth
Tax History
| Year | Tax Paid | Tax Assessment Tax Assessment Total Assessment is a certain percentage of the fair market value that is determined by local assessors to be the total taxable value of land and additions on the property. | Land | Improvement |
|---|---|---|---|---|
| 2026 | $2,142 | $171,800 | $34,360 | $137,440 |
| 2025 | $2,142 | $171,800 | $34,360 | $137,440 |
| 2024 | $2,142 | $171,800 | $34,360 | $137,440 |
| 2023 | $2,142 | $153,000 | $30,600 | $122,400 |
| 2022 | $1,022 | $108,000 | $30,600 | $77,400 |
| 2021 | $1,550 | $0 | $0 | $0 |
| 2020 | $1,550 | $0 | $0 | $0 |
| 2019 | $1,439 | $0 | $0 | $0 |
| 2018 | $1,299 | $0 | $0 | $0 |
| 2017 | $1,299 | $0 | $0 | $0 |
| 2016 | $879 | $0 | $0 | $0 |
| 2015 | $842 | $0 | $0 | $0 |
| 2014 | -- | $92,800 | $16,996 | $75,804 |
| 2012 | -- | $12,128 | $2,174 | $9,954 |
Source: Public Records
Map
Nearby Homes
- 1006 E Luzerne St
- 1002 E Luzerne St
- 1008 E Luzerne St
- 1000 E Luzerne St
- 3943 I St
- 1010 E Luzerne St
- 1012 E Luzerne St
- 3942 Palmetto St
- 3941 I St
- 3940 Palmetto St
- 3939 I St
- 3938 Palmetto St
- 3937 I St
- 3936 Palmetto St
- 3935 I St
- 3934 Palmetto St
- 1013 E Luzerne St
- 1005 E Luzerne St
- 3933 I St
- 1007 E Luzerne St