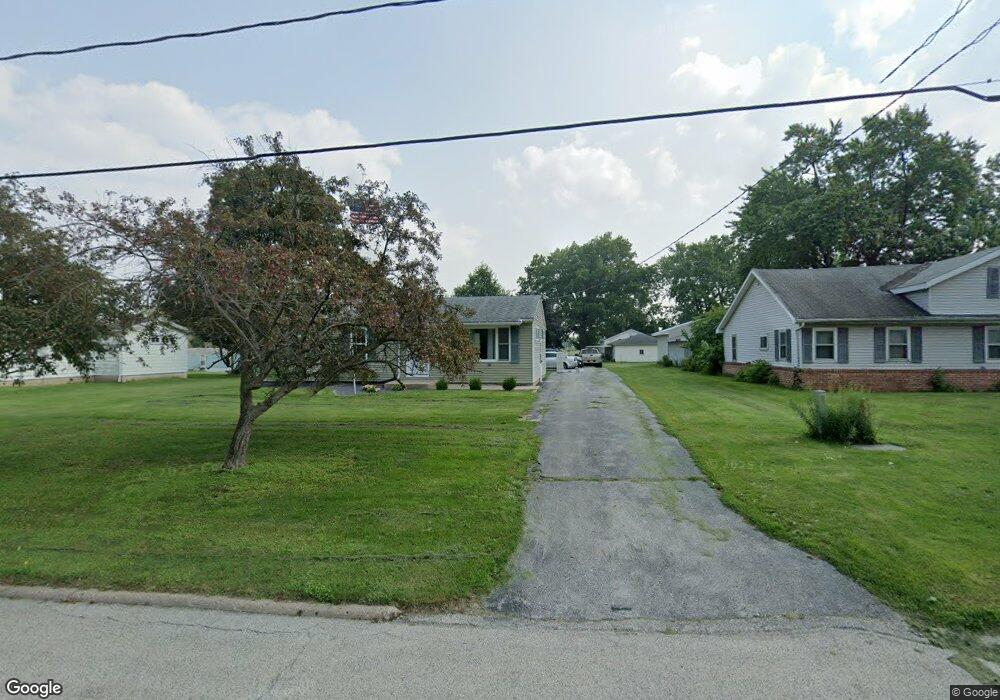
1004 E Main St Knoxville, IL 61448
Estimated Value: $105,000 - $129,000
--
Bed
--
Bath
960
Sq Ft
$123/Sq Ft
Est. Value
About This Home
This home is located at 1004 E Main St, Knoxville, IL 61448 and is currently estimated at $117,985, approximately $122 per square foot. 1004 E Main St is a home located in Knox County with nearby schools including Mable Woolsey Elementary School, Knoxville Junior High School, and Knoxville Senior High School.
Ownership History
Date
Name
Owned For
Owner Type
Purchase Details
Closed on
Oct 28, 2022
Sold by
Quinn Anthony M and Quinn Tracey A
Bought by
Hennenfent Case L and Ponder Shelby J
Current Estimated Value
Home Financials for this Owner
Home Financials are based on the most recent Mortgage that was taken out on this home.
Original Mortgage
$80,000
Outstanding Balance
$77,041
Interest Rate
5.97%
Mortgage Type
Construction
Estimated Equity
$40,944
Purchase Details
Closed on
Aug 13, 2009
Sold by
Ponder Drew A
Bought by
Quinn Anthony M and Quinn Tracey A
Home Financials for this Owner
Home Financials are based on the most recent Mortgage that was taken out on this home.
Original Mortgage
$76,500
Interest Rate
3.5%
Mortgage Type
New Conventional
Create a Home Valuation Report for This Property
The Home Valuation Report is an in-depth analysis detailing your home's value as well as a comparison with similar homes in the area
Home Values in the Area
Average Home Value in this Area
Purchase History
| Date | Buyer | Sale Price | Title Company |
|---|---|---|---|
| Hennenfent Case L | $100,000 | Western Illinois Title | |
| Quinn Anthony M | $75,000 | Attorney Only |
Source: Public Records
Mortgage History
| Date | Status | Borrower | Loan Amount |
|---|---|---|---|
| Open | Hennenfent Case L | $80,000 | |
| Previous Owner | Quinn Anthony M | $76,500 | |
| Closed | Quinn Anthony M | $76,500 |
Source: Public Records
Tax History Compared to Growth
Tax History
| Year | Tax Paid | Tax Assessment Tax Assessment Total Assessment is a certain percentage of the fair market value that is determined by local assessors to be the total taxable value of land and additions on the property. | Land | Improvement |
|---|---|---|---|---|
| 2024 | $2,901 | $35,980 | $2,140 | $33,840 |
| 2023 | $2,901 | $32,470 | $1,930 | $30,540 |
| 2022 | $2,000 | $30,420 | $1,810 | $28,610 |
| 2021 | $1,853 | $28,700 | $1,710 | $26,990 |
| 2020 | $1,813 | $27,860 | $1,660 | $26,200 |
| 2019 | $1,778 | $27,320 | $1,630 | $25,690 |
| 2018 | $1,723 | $26,520 | $1,580 | $24,940 |
| 2017 | $1,709 | $26,250 | $1,560 | $24,690 |
| 2015 | -- | $25,480 | $1,510 | $23,970 |
| 2013 | $1,165 | $24,980 | $1,480 | $23,500 |
Source: Public Records
Map
Nearby Homes
- 0 Gilson St
- 703 Walnut St
- 520 Newman St
- 409 E South St
- 406 Newman St
- 209 S Broad St
- 107 Oakview Dr
- 614 S Broad St
- 208 S Market St
- 145 Northview Dr
- 1254 Steakhouse Rd
- 784 S Broad St
- 973 Knox Road 1330n Rd
- 1072 Joni Dr
- 503 W Ann St
- 418 W Main St
- 698 Eiker Dr
- 304 Galesburg Rd
- 308 Galesburg Rd
- 175 Willow Ln