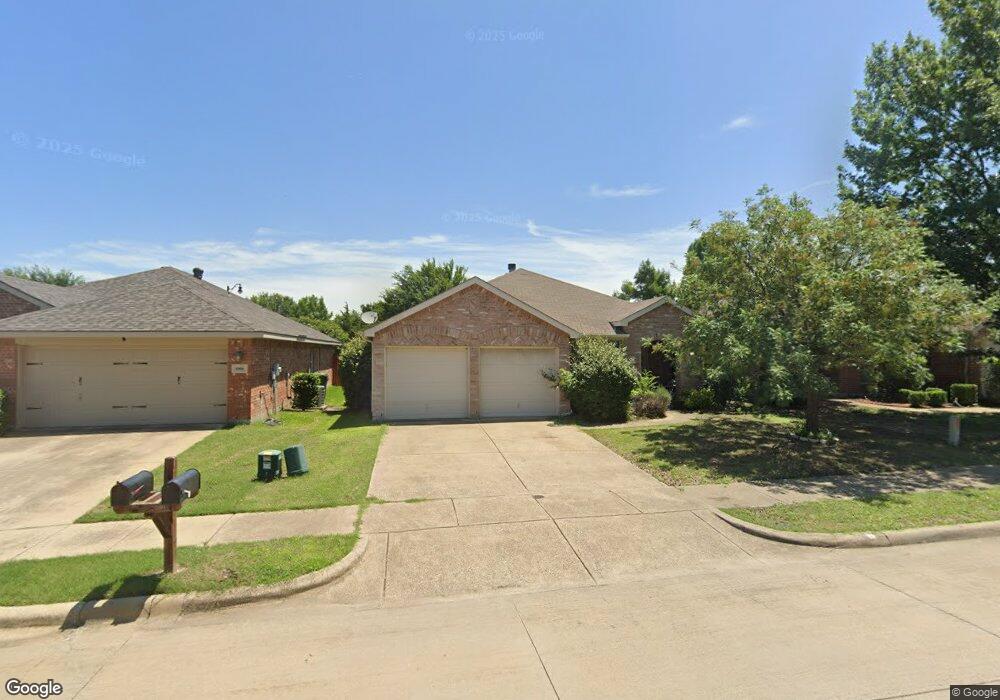
1004 Ingram Dr Forney, TX 75126
Estimated Value: $247,000 - $263,235
3
Beds
2
Baths
1,662
Sq Ft
$153/Sq Ft
Est. Value
About This Home
This home is located at 1004 Ingram Dr, Forney, TX 75126 and is currently estimated at $254,809, approximately $153 per square foot. 1004 Ingram Dr is a home located in Kaufman County with nearby schools including Lewis Elementary School, Rhodes Intermediate School, and Jackson Middle School.
Ownership History
Date
Name
Owned For
Owner Type
Purchase Details
Closed on
Sep 9, 2020
Sold by
Chavez Jose Carlos
Bought by
Mccamm Danielle Nicole
Current Estimated Value
Purchase Details
Closed on
Jan 24, 2012
Sold by
Wei Wu
Bought by
He Di
Purchase Details
Closed on
Aug 9, 2010
Sold by
Citimortgage Inc
Bought by
The Secretary Of Housing & Urban Develop
Purchase Details
Closed on
Aug 3, 2010
Sold by
Wallace Amanda K and Wallace Hershal L
Bought by
Citimortgage Inc
Purchase Details
Closed on
Feb 2, 2007
Sold by
Horizon Homes Ltd
Bought by
Wallace Amanda K and Wallace Hershal L
Home Financials for this Owner
Home Financials are based on the most recent Mortgage that was taken out on this home.
Original Mortgage
$136,223
Interest Rate
6.19%
Mortgage Type
Purchase Money Mortgage
Purchase Details
Closed on
Jun 23, 2006
Sold by
Travis Ranch Development Lp
Bought by
Horizon Homes Ltd
Create a Home Valuation Report for This Property
The Home Valuation Report is an in-depth analysis detailing your home's value as well as a comparison with similar homes in the area
Home Values in the Area
Average Home Value in this Area
Purchase History
| Date | Buyer | Sale Price | Title Company |
|---|---|---|---|
| Mccamm Danielle Nicole | -- | Capital Title Of Texas Llc | |
| He Di | -- | None Available | |
| Wei Wu | -- | None Available | |
| The Secretary Of Housing & Urban Develop | -- | None Available | |
| Citimortgage Inc | $140,137 | None Available | |
| Wallace Amanda K | -- | None Available | |
| Horizon Homes Ltd | -- | None Available |
Source: Public Records
Mortgage History
| Date | Status | Borrower | Loan Amount |
|---|---|---|---|
| Previous Owner | Wallace Amanda K | $136,223 |
Source: Public Records
Tax History
| Year | Tax Paid | Tax Assessment Tax Assessment Total Assessment is a certain percentage of the fair market value that is determined by local assessors to be the total taxable value of land and additions on the property. | Land | Improvement |
|---|---|---|---|---|
| 2025 | $7,132 | $269,179 | $75,000 | $194,179 |
| 2024 | $7,132 | $287,687 | $90,000 | $197,687 |
| 2023 | $7,874 | $318,553 | $100,000 | $218,553 |
| 2022 | $7,057 | $264,475 | $70,000 | $194,475 |
| 2021 | $5,813 | $206,892 | $50,000 | $156,892 |
| 2020 | $5,484 | $195,170 | $50,000 | $145,170 |
| 2019 | $5,885 | $192,390 | $50,000 | $142,390 |
| 2018 | $5,760 | $188,310 | $30,000 | $158,310 |
| 2017 | $5,303 | $173,360 | $30,000 | $143,360 |
| 2016 | $4,901 | $160,230 | $30,000 | $130,230 |
| 2015 | $4,041 | $135,410 | $30,000 | $105,410 |
| 2014 | $4,041 | $132,660 | $0 | $0 |
Source: Public Records
Map
Nearby Homes
- 1016 Ingram Dr
- 1013 Rumley Rd
- 1113 Mount Olive Ln
- 1008 Talpa Ln
- 0 Co Road 218 Unit 20900765
- 1025 Bend Ct
- 1011 Comfort Dr
- 2063 Henrietta Dr
- 1021 Comfort Dr
- 2047 Jack County Dr
- 2044 Jack County Dr
- 2005 Zavala Dr
- 2000 New Braunfels
- 2011 New Braunfels
- 1010 Trickham Dr
- 2008 New Braunfels
- 2031 Jack County Dr
- 1205 Templin Ave
- 1101 Johnson City Ave
- 1012 Alexa Dr
- 1006 Ingram Dr
- 1002 Ingram Dr
- 1008 Ingram Dr
- 1000 Ingram Dr
- 1010 Ingram Dr
- 1005 Ingram Dr
- 1007 Ingram Dr
- 1003 Ingram Dr
- 1009 Ingram Dr
- 1001 Ingram Dr
- 1012 Ingram Dr
- 1011 Ingram Dr
- 1001 Grimes Dr
- 1003 Grimes Dr
- 1014 Ingram Dr
- 1013 Ingram Dr
- 1006 Mount Olive Ln
- 1004 Rumley Rd
- 1004 Mount Olive Ln
- 1008 Mount Olive Ln
Your Personal Tour Guide
Ask me questions while you tour the home.