1004 Key St Bellingham, WA 98225
Sehome NeighborhoodEstimated Value: $710,581 - $848,000
3
Beds
2
Baths
1,484
Sq Ft
$520/Sq Ft
Est. Value
About This Home
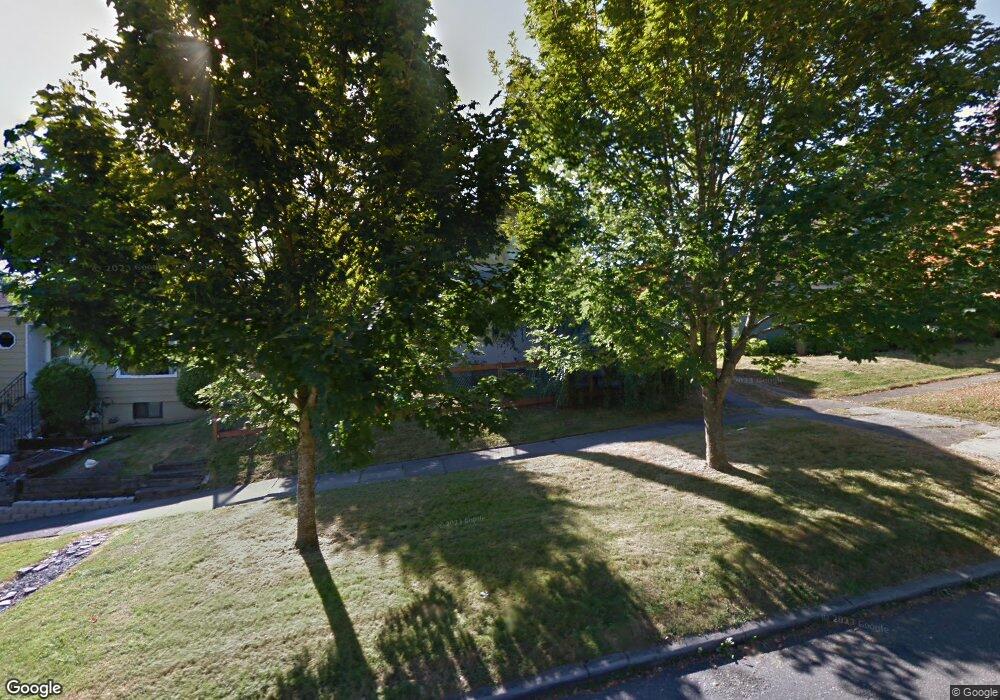
This home is located at 1004 Key St, Bellingham, WA 98225 and is currently estimated at $772,395, approximately $520 per square foot. 1004 Key St is a home located in Whatcom County with nearby schools including Happy Valley Elementary School, Fairhaven Middle School, and Sehome High School.
Ownership History
Date
Name
Owned For
Owner Type
Purchase Details
Closed on
Oct 9, 2008
Sold by
Nim Deanna
Bought by
Collins Brooks T
Current Estimated Value
Home Financials for this Owner
Home Financials are based on the most recent Mortgage that was taken out on this home.
Original Mortgage
$195,000
Outstanding Balance
$129,422
Interest Rate
6.39%
Mortgage Type
Purchase Money Mortgage
Estimated Equity
$642,973
Purchase Details
Closed on
Oct 7, 2008
Sold by
Bayliss Nicholas James and Philyaw Jessica Bayliss
Bought by
Collins Brooks T
Home Financials for this Owner
Home Financials are based on the most recent Mortgage that was taken out on this home.
Original Mortgage
$195,000
Outstanding Balance
$129,422
Interest Rate
6.39%
Mortgage Type
Purchase Money Mortgage
Estimated Equity
$642,973
Purchase Details
Closed on
Oct 15, 2003
Sold by
Gray Douglas T and Gray Sherry A
Bought by
Bayliss Peter
Purchase Details
Closed on
Oct 20, 2000
Sold by
Waninski Jerome E
Bought by
Gray Douglas T and Gray Sherry A
Create a Home Valuation Report for This Property
The Home Valuation Report is an in-depth analysis detailing your home's value as well as a comparison with similar homes in the area
Home Values in the Area
Average Home Value in this Area
Purchase History
| Date | Buyer | Sale Price | Title Company |
|---|---|---|---|
| Collins Brooks T | -- | Stewart Title Company | |
| Collins Brooks T | $305,280 | Stewart Title Company | |
| Bayliss Peter | -- | Whatcom Land Title | |
| Gray Douglas T | $138,485 | -- |
Source: Public Records
Mortgage History
| Date | Status | Borrower | Loan Amount |
|---|---|---|---|
| Open | Collins Brooks T | $195,000 |
Source: Public Records
Tax History Compared to Growth
Tax History
| Year | Tax Paid | Tax Assessment Tax Assessment Total Assessment is a certain percentage of the fair market value that is determined by local assessors to be the total taxable value of land and additions on the property. | Land | Improvement |
|---|---|---|---|---|
| 2024 | $5,077 | $636,145 | $318,140 | $318,005 |
| 2023 | $5,077 | $652,341 | $326,240 | $326,101 |
| 2022 | $4,012 | $552,842 | $276,480 | $276,362 |
| 2021 | $3,936 | $431,908 | $216,000 | $215,908 |
| 2020 | $3,889 | $399,915 | $200,000 | $199,915 |
| 2019 | $3,664 | $381,917 | $203,500 | $178,417 |
| 2018 | $3,689 | $360,753 | $192,308 | $168,445 |
| 2017 | $3,212 | $310,608 | $165,275 | $145,333 |
| 2016 | $2,878 | $282,624 | $150,288 | $132,336 |
| 2015 | $2,885 | $263,583 | $141,763 | $121,820 |
| 2014 | -- | $255,657 | $137,500 | $118,157 |
| 2013 | -- | $243,541 | $132,750 | $110,791 |
Source: Public Records
Map
Nearby Homes
- 615 E Myrtle St
- 616 E Myrtle St
- 1205 E Maple St
- 1125 Otis St
- 1234 Grant St
- 1126 N Forest St
- 1309 Billy Frank Jr St
- 901 N Forest St Unit 107
- 901 N Forest St Unit 125
- 901 N Forest St Unit 109
- 310 E Ivy St
- 1001 N State St Unit 403
- 1031 N State St Unit 107
- 1031 N State St Unit 209
- 1335 Humboldt St
- 1015 Railroad Ave Unit 418
- 1200 Lincoln St Unit 196
- 1200 Lincoln St Unit 117
- 1200 Lincoln St Unit 154
- 5 XX Gladstone St