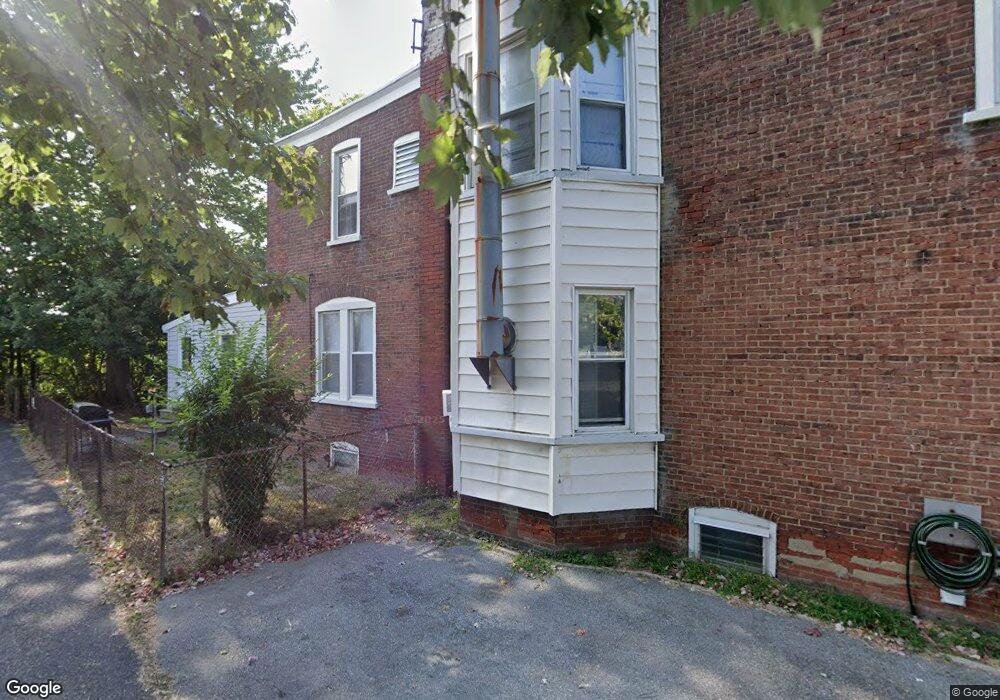
1004 Mcclenahan Terrace Marcus Hook, PA 19061
Estimated Value: $143,000 - $191,000
3
Beds
1
Bath
1,552
Sq Ft
$109/Sq Ft
Est. Value
About This Home
This home is located at 1004 Mcclenahan Terrace, Marcus Hook, PA 19061 and is currently estimated at $168,551, approximately $108 per square foot. 1004 Mcclenahan Terrace is a home located in Delaware County with nearby schools including Chichester Senior High School, Chester Charter School for the Arts, and Archmere Academy.
Ownership History
Date
Name
Owned For
Owner Type
Purchase Details
Closed on
Sep 27, 2025
Sold by
Mahoney Edward L
Bought by
Motley Bonnie J and Mahoney Edward L
Current Estimated Value
Purchase Details
Closed on
Sep 26, 2016
Sold by
Castro Julian
Bought by
Mahoney Edward
Purchase Details
Closed on
Jul 30, 2015
Sold by
Lakeview Loan Servicing Llc
Bought by
Secretary Of Housing & Urban Development
Purchase Details
Closed on
Apr 14, 2015
Sold by
Colfer Ronnie
Bought by
Lakeview Loan Servicing Llc
Purchase Details
Closed on
Oct 16, 2008
Sold by
Keeley John H
Bought by
Colfer Ronnie
Home Financials for this Owner
Home Financials are based on the most recent Mortgage that was taken out on this home.
Original Mortgage
$102,695
Interest Rate
6.13%
Mortgage Type
FHA
Purchase Details
Closed on
Feb 15, 2008
Sold by
Bell Janet Kay
Bought by
Keeley John H
Create a Home Valuation Report for This Property
The Home Valuation Report is an in-depth analysis detailing your home's value as well as a comparison with similar homes in the area
Home Values in the Area
Average Home Value in this Area
Purchase History
| Date | Buyer | Sale Price | Title Company |
|---|---|---|---|
| Motley Bonnie J | -- | None Listed On Document | |
| Mahoney Edward | $30,000 | None Available | |
| Secretary Of Housing & Urban Development | -- | None Available | |
| Lakeview Loan Servicing Llc | -- | None Available | |
| Colfer Ronnie | $103,000 | None Available | |
| Keeley John H | $59,900 | None Available |
Source: Public Records
Mortgage History
| Date | Status | Borrower | Loan Amount |
|---|---|---|---|
| Previous Owner | Colfer Ronnie | $102,695 |
Source: Public Records
Tax History Compared to Growth
Tax History
| Year | Tax Paid | Tax Assessment Tax Assessment Total Assessment is a certain percentage of the fair market value that is determined by local assessors to be the total taxable value of land and additions on the property. | Land | Improvement |
|---|---|---|---|---|
| 2025 | $3,392 | $82,670 | $21,190 | $61,480 |
| 2024 | $3,392 | $82,670 | $21,190 | $61,480 |
| 2023 | $3,139 | $82,670 | $21,190 | $61,480 |
| 2022 | $2,991 | $82,670 | $21,190 | $61,480 |
| 2021 | $4,203 | $82,670 | $21,190 | $61,480 |
| 2020 | $3,686 | $63,910 | $20,150 | $43,760 |
| 2019 | $3,686 | $63,910 | $20,150 | $43,760 |
| 2018 | $3,694 | $63,910 | $0 | $0 |
| 2017 | $3,669 | $63,910 | $0 | $0 |
| 2016 | $351 | $63,910 | $0 | $0 |
| 2015 | $351 | $63,910 | $0 | $0 |
| 2014 | $351 | $63,910 | $0 | $0 |
Source: Public Records
Map
Nearby Homes
- 1019 Yates Ave
- 809 1/2 Market St
- 1 Walnut St
- 1029 Green St
- 1359 Green St
- 1363 Green St
- 4412 Post Rd
- 1412 Simpson St
- 3418-3420-3422 W 4th St
- 125 White Ave
- 160 White Ave
- 210 Harvey Ave
- 101 Chadwick Ave
- 138 W Ridge Rd
- 160 W Ridge Rd
- 16 Richardson Ave
- 604-608 Main St
- 1425 Hewes Ave
- 1616 Ward St
- 1526 Weber Dr
- 1004 McClenachan Terrace
- 1002 McClenachan Terrace
- 1002 Mcclenahan Terrace
- 1010 Mcclenahan Terrace
- 1012 Mcclenahan Terrace
- 1012 McClenachan Terrace
- 104 E 10th St
- 102 E 10th St
- 106 E 10th St
- 100 E 10th St
- 108 E 10th St
- 1014 Mcclenahan Terrace
- 1014 McClenachan Terrace
- 634 E 10th St
- 1007 Mcclenahan Terrace
- 1005 Mcclenahan Terrace
- 1007 McClenachan Terrace
- 1003 McClenachan Terrace
- 1003 Mcclenahan Terrace
- 1009 Mcclenahan Terrace