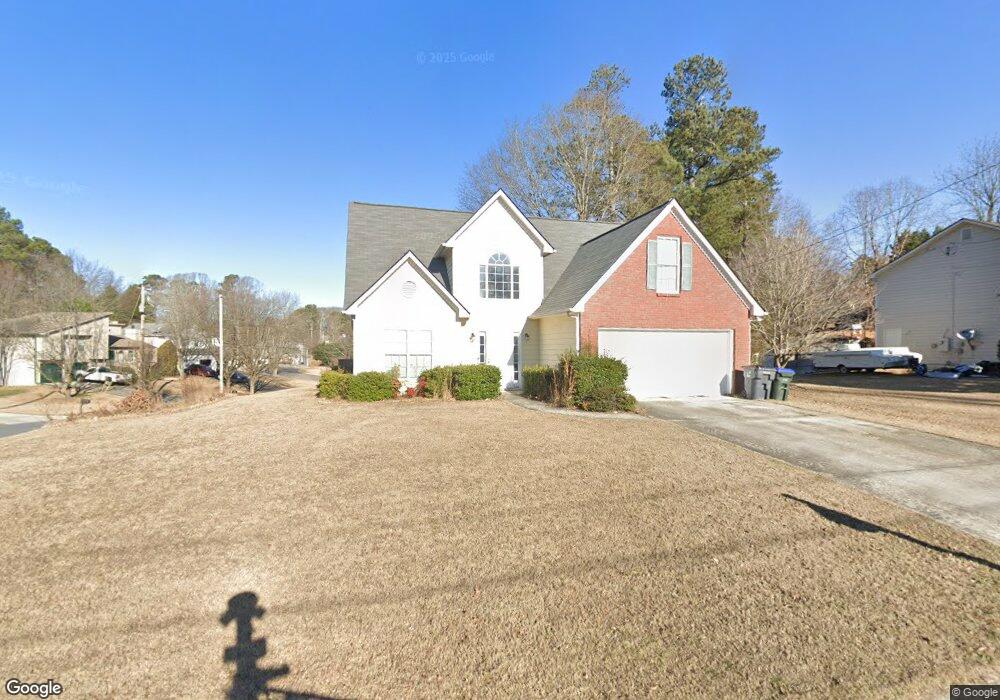
1004 Megan Ct Unit 3 Sugar Hill, GA 30518
Estimated Value: $356,000 - $362,000
3
Beds
2
Baths
1,740
Sq Ft
$206/Sq Ft
Est. Value
About This Home
This home is located at 1004 Megan Ct Unit 3, Sugar Hill, GA 30518 and is currently estimated at $358,231, approximately $205 per square foot. 1004 Megan Ct Unit 3 is a home located in Gwinnett County with nearby schools including Sycamore Elementary School, Lanier Middle School, and Lanier High School.
Ownership History
Date
Name
Owned For
Owner Type
Purchase Details
Closed on
Dec 7, 2018
Sold by
Smith Aaron Jackson
Bought by
Smith Patricia Lynn
Current Estimated Value
Purchase Details
Closed on
May 12, 2003
Sold by
Gsrpm Mtg Trust
Bought by
Smith Aaron J and Smith Patricia
Home Financials for this Owner
Home Financials are based on the most recent Mortgage that was taken out on this home.
Original Mortgage
$129,900
Interest Rate
5.81%
Mortgage Type
New Conventional
Purchase Details
Closed on
Nov 5, 2002
Sold by
Moore Pierce L and Moore Sharon L
Bought by
Gsrpm Mtg Trust
Purchase Details
Closed on
Apr 2, 1996
Sold by
Denney Construction Co Inc
Bought by
Moore Pierce Sharon
Create a Home Valuation Report for This Property
The Home Valuation Report is an in-depth analysis detailing your home's value as well as a comparison with similar homes in the area
Home Values in the Area
Average Home Value in this Area
Purchase History
| Date | Buyer | Sale Price | Title Company |
|---|---|---|---|
| Smith Patricia Lynn | -- | -- | |
| Smith Aaron J | $129,900 | -- | |
| Gsrpm Mtg Trust | $106,001 | -- | |
| Moore Pierce Sharon | $105,500 | -- |
Source: Public Records
Mortgage History
| Date | Status | Borrower | Loan Amount |
|---|---|---|---|
| Previous Owner | Smith Aaron J | $129,900 | |
| Closed | Moore Pierce Sharon | $0 |
Source: Public Records
Tax History Compared to Growth
Tax History
| Year | Tax Paid | Tax Assessment Tax Assessment Total Assessment is a certain percentage of the fair market value that is determined by local assessors to be the total taxable value of land and additions on the property. | Land | Improvement |
|---|---|---|---|---|
| 2025 | $375 | $116,800 | $24,000 | $92,800 |
| 2024 | $609 | $116,800 | $24,000 | $92,800 |
| 2023 | $609 | $120,600 | $24,000 | $96,600 |
| 2022 | $609 | $117,600 | $20,000 | $97,600 |
| 2021 | $609 | $83,400 | $16,000 | $67,400 |
| 2020 | $3 | $75,640 | $12,800 | $62,840 |
| 2019 | $831 | $68,440 | $12,800 | $55,640 |
| 2018 | $775 | $53,840 | $10,800 | $43,040 |
| 2016 | $594 | $41,880 | $6,800 | $35,080 |
| 2015 | $1,442 | $41,880 | $6,800 | $35,080 |
| 2014 | -- | $41,880 | $6,800 | $35,080 |
Source: Public Records
Map
Nearby Homes
- 965 Sugar Meadow Dr
- 978 Sugar Vista Cir
- 1025 Hunters Oak Trail
- 5605 Austin Garner Rd
- 5650 Princeton Oaks Dr
- 5680 Princeton Oaks Dr
- 1114 Danube Trail
- 5671 Arbor Green Cir
- 5557 Pinedale Cir
- 915 Riverside Rd Unit 3
- 818 Pond View Ct
- 5730 Arbor Green Cir
- 1150 Sycamore Creek Trail
- 5840 Stephens Mill Dr
- 5757 Riverside Dr Unit 2
- 5660 Winter Bluff Way
- 5689 Winter Bluff Way
- 1024 Megan Ct
- 5485 Princeton Oaks Dr
- 5545 Princeton Oaks Dr
- 5510 Princeton Oaks Dr
- 5500 Princeton Oaks Dr
- 1019 Megan Ct Unit 3
- 5520 Princeton Oaks Dr
- 5520 Princeton Oaks Dr Unit 5520
- 1044 Megan Ct
- 5565 Princeton Oaks Dr
- 5490 Princeton Oaks Dr
- 5475 Princeton Oaks Dr Unit 3
- 5530 Princeton Oaks Dr
- 0 Megan Ct Unit 7074946
- 0 Megan Ct Unit 3231834
- 5480 Princeton Oaks Dr
- 5540 Princeton Oaks Dr
- 5575 Princeton Oaks Dr
- 1064 Megan Ct
- 1049 Megan Ct