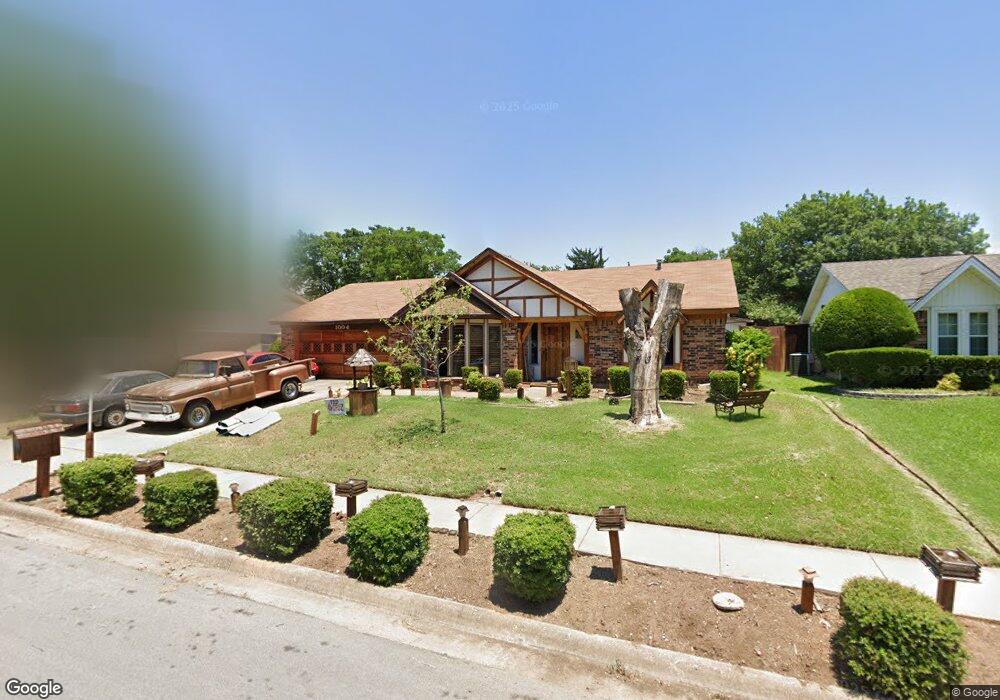
1004 Monterrey St Bedford, TX 76022
Estimated Value: $344,000 - $364,000
3
Beds
2
Baths
1,753
Sq Ft
$202/Sq Ft
Est. Value
About This Home
This home is located at 1004 Monterrey St, Bedford, TX 76022 and is currently estimated at $354,106, approximately $202 per square foot. 1004 Monterrey St is a home located in Tarrant County with nearby schools including Bell Manor Elementary School, Central J High School, and Trinity High School.
Ownership History
Date
Name
Owned For
Owner Type
Purchase Details
Closed on
Mar 24, 2015
Sold by
Ellis William M
Bought by
Ellis William M and William M Ellis Revocable Living Trust
Current Estimated Value
Create a Home Valuation Report for This Property
The Home Valuation Report is an in-depth analysis detailing your home's value as well as a comparison with similar homes in the area
Home Values in the Area
Average Home Value in this Area
Purchase History
| Date | Buyer | Sale Price | Title Company |
|---|---|---|---|
| Ellis William M | -- | None Available |
Source: Public Records
Tax History Compared to Growth
Tax History
| Year | Tax Paid | Tax Assessment Tax Assessment Total Assessment is a certain percentage of the fair market value that is determined by local assessors to be the total taxable value of land and additions on the property. | Land | Improvement |
|---|---|---|---|---|
| 2025 | $1,087 | $349,368 | $65,000 | $284,368 |
| 2024 | $1,124 | $349,368 | $65,000 | $284,368 |
| 2023 | $5,731 | $331,863 | $45,000 | $286,863 |
| 2022 | $5,933 | $287,288 | $45,000 | $242,288 |
| 2021 | $5,817 | $254,920 | $45,000 | $209,920 |
| 2020 | $5,338 | $231,229 | $45,000 | $186,229 |
| 2019 | $4,958 | $232,807 | $45,000 | $187,807 |
| 2018 | $2,155 | $185,541 | $18,000 | $167,541 |
| 2017 | $4,080 | $186,450 | $18,000 | $168,450 |
| 2016 | $3,710 | $171,418 | $18,000 | $153,418 |
| 2015 | -- | $139,400 | $18,000 | $121,400 |
| 2014 | -- | $139,400 | $18,000 | $121,400 |
Source: Public Records
Map
Nearby Homes
- 1613 Trinity Ct
- 933 Charleston Ct
- 1604 Richmond Dr
- 952 Charleston Dr
- 1701 Winchester Way
- 1031 Boston Blvd
- 904 Nelson Terrace
- 804 Natchez Ave
- 1004 Overhill Dr
- 2024 Charleston Dr
- 921 Overhill Dr
- 909 Overhill Dr
- 2101 Gettysburg Place
- 2025 Schumac Ln
- 1204 Edgecliff Dr
- 2201 Greendale Ct
- 828 Gregory Ave
- 1509 Shirley Way
- 808 Gregory Ave
- 1213 Greendale Dr
- 1008 Monterrey St
- 1000 Monterrey St
- 1605 Trinity Ct
- 1012 Monterrey St
- 1013 Atlanta Dr
- 1009 Atlanta Dr
- 1432 Bryan Dr
- 1609 Trinity Ct
- 1009 Monterrey St
- 1005 Monterrey St
- 1600 Trinity Ct
- 1016 Monterrey St
- 1604 Trinity Ct
- 1001 Monterrey St
- 1428 Bryan Dr
- 1608 Trinity Ct
- 1017 Atlanta Dr
- 917 Monterrey St
- 1005 Atlanta Dr Unit 4
- 1424 Bryan Dr