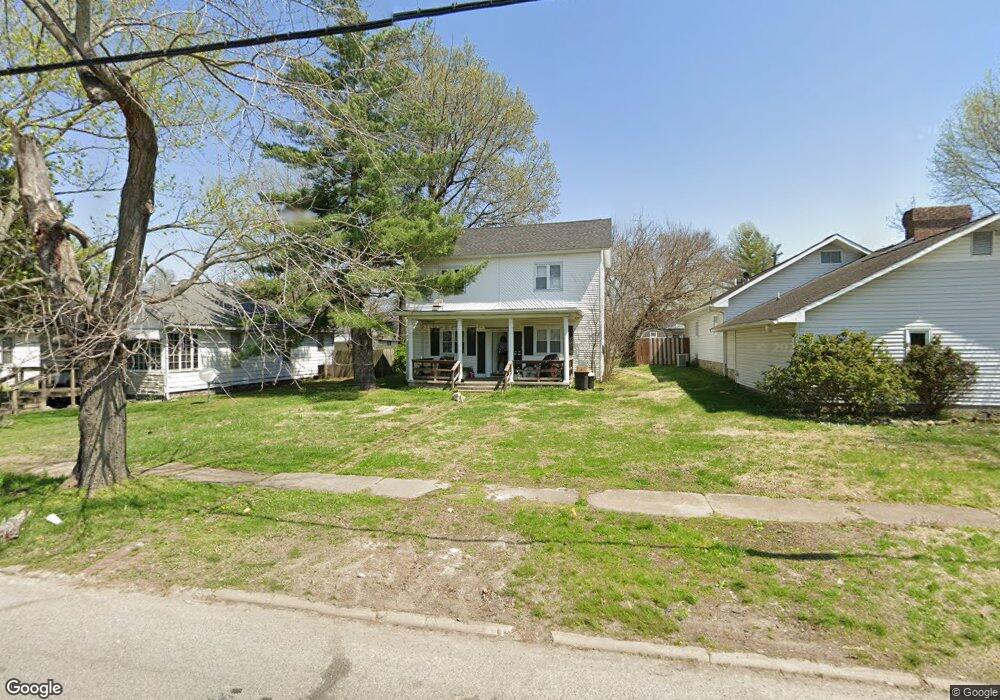
1004 N 13th St Herrin, IL 62948
Estimated Value: $84,000 - $161,000
Studio
--
Bath
2,272
Sq Ft
$58/Sq Ft
Est. Value
About This Home
This home is located at 1004 N 13th St, Herrin, IL 62948 and is currently estimated at $130,709, approximately $57 per square foot. 1004 N 13th St is a home located in Williamson County with nearby schools including North Side Primary Center, Herrin Community Elementary School, and Herrin Middle School.
Ownership History
Date
Name
Owned For
Owner Type
Purchase Details
Closed on
Apr 19, 2018
Sold by
Jecc Investment Llc
Bought by
Cyil Properties Llc
Current Estimated Value
Home Financials for this Owner
Home Financials are based on the most recent Mortgage that was taken out on this home.
Original Mortgage
$453,600
Outstanding Balance
$366,084
Interest Rate
4.44%
Mortgage Type
New Conventional
Estimated Equity
-$235,375
Purchase Details
Closed on
Jan 17, 2018
Sold by
Seever Homes Partnership
Bought by
Jecc Investment Llc
Create a Home Valuation Report for This Property
The Home Valuation Report is an in-depth analysis detailing your home's value as well as a comparison with similar homes in the area
Home Values in the Area
Average Home Value in this Area
Purchase History
| Date | Buyer | Sale Price | Title Company |
|---|---|---|---|
| Cyil Properties Llc | $178,000 | Patchett Hampson And Garrison | |
| Jecc Investment Llc | -- | -- |
Source: Public Records
Mortgage History
| Date | Status | Borrower | Loan Amount |
|---|---|---|---|
| Open | Cyil Properties Llc | $453,600 | |
| Closed | Cyil Properties Llc | $113,400 |
Source: Public Records
Tax History
| Year | Tax Paid | Tax Assessment Tax Assessment Total Assessment is a certain percentage of the fair market value that is determined by local assessors to be the total taxable value of land and additions on the property. | Land | Improvement |
|---|---|---|---|---|
| 2025 | $2,753 | $31,660 | $3,160 | $28,500 |
| 2024 | $2,753 | $31,660 | $3,160 | $28,500 |
| 2023 | $2,753 | $31,660 | $3,160 | $28,500 |
| 2022 | $2,385 | $27,890 | $2,780 | $25,110 |
| 2021 | $2,319 | $26,880 | $2,680 | $24,200 |
| 2020 | $2,319 | $25,390 | $2,530 | $22,860 |
| 2019 | $2,158 | $25,390 | $2,530 | $22,860 |
| 2018 | $2,158 | $25,390 | $2,530 | $22,860 |
| 2017 | $1,435 | $17,280 | $2,530 | $14,750 |
| 2015 | $1,373 | $16,370 | $2,400 | $13,970 |
| 2013 | $1,068 | $16,370 | $2,400 | $13,970 |
| 2012 | $1,068 | $16,370 | $2,400 | $13,970 |
Source: Public Records
Map
Nearby Homes