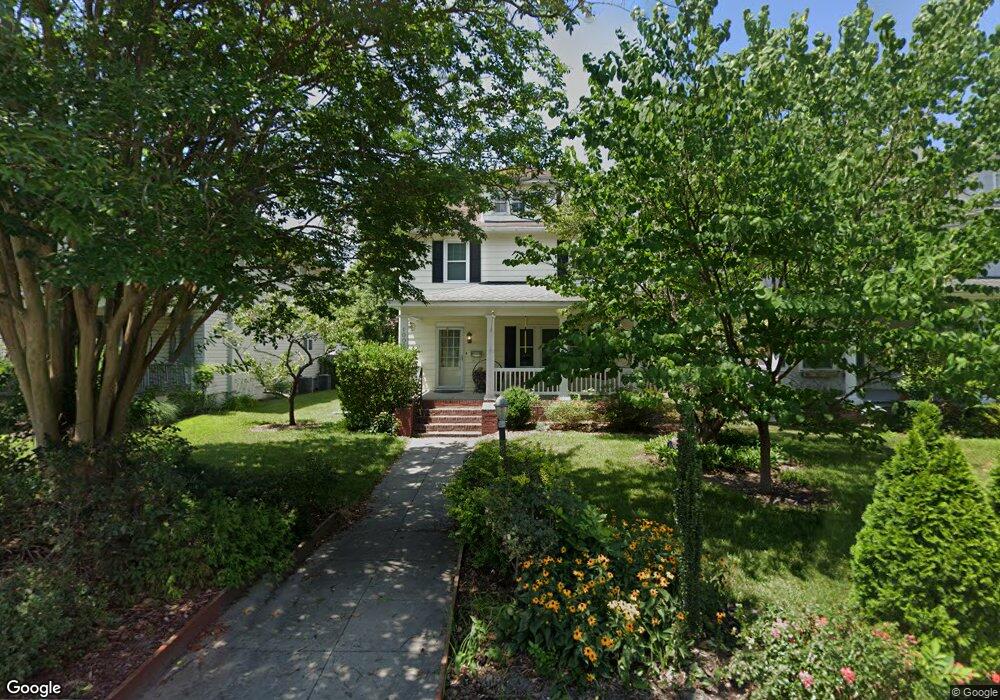
1004 N Division St Salisbury, MD 21801
Newtown-North Division NeighborhoodEstimated Value: $264,000 - $311,000
4
Beds
3
Baths
1,756
Sq Ft
$166/Sq Ft
Est. Value
About This Home
This home is located at 1004 N Division St, Salisbury, MD 21801 and is currently estimated at $290,718, approximately $165 per square foot. 1004 N Division St is a home located in Wicomico County with nearby schools including West Salisbury Elementary School, North Salisbury Elementary School, and Salisbury Middle School.
Ownership History
Date
Name
Owned For
Owner Type
Purchase Details
Closed on
Dec 16, 2014
Sold by
Walker Jennifer Istre
Bought by
Miller Jarrod O
Current Estimated Value
Home Financials for this Owner
Home Financials are based on the most recent Mortgage that was taken out on this home.
Original Mortgage
$124,000
Outstanding Balance
$95,228
Interest Rate
3.99%
Mortgage Type
New Conventional
Estimated Equity
$195,490
Purchase Details
Closed on
Oct 15, 2009
Sold by
Walker Russell C and Walker Jennifer I
Bought by
Walker Jennifer Istre
Purchase Details
Closed on
Nov 5, 2003
Sold by
Istre Jennifer L
Bought by
Walker Russell C and Walker Jennifer I
Purchase Details
Closed on
Oct 12, 1995
Sold by
Martin Catherine A L and Martin E
Bought by
Istre Jennifer L
Create a Home Valuation Report for This Property
The Home Valuation Report is an in-depth analysis detailing your home's value as well as a comparison with similar homes in the area
Home Values in the Area
Average Home Value in this Area
Purchase History
| Date | Buyer | Sale Price | Title Company |
|---|---|---|---|
| Miller Jarrod O | $155,000 | Mid Atlantic Title & Escrow | |
| Walker Jennifer Istre | -- | -- | |
| Walker Russell C | -- | -- | |
| Istre Jennifer L | $76,000 | -- |
Source: Public Records
Mortgage History
| Date | Status | Borrower | Loan Amount |
|---|---|---|---|
| Open | Miller Jarrod O | $124,000 | |
| Closed | Walker Jennifer Istre | -- |
Source: Public Records
Tax History
| Year | Tax Paid | Tax Assessment Tax Assessment Total Assessment is a certain percentage of the fair market value that is determined by local assessors to be the total taxable value of land and additions on the property. | Land | Improvement |
|---|---|---|---|---|
| 2025 | $1,258 | $196,100 | $0 | $0 |
| 2024 | $1,245 | $179,000 | $18,100 | $160,900 |
| 2023 | $1,215 | $165,367 | $0 | $0 |
| 2022 | $1,185 | $151,733 | $0 | $0 |
| 2021 | $1,076 | $138,100 | $18,100 | $120,000 |
| 2020 | $1,076 | $138,100 | $18,100 | $120,000 |
| 2019 | $1,033 | $138,100 | $18,100 | $120,000 |
| 2018 | $1,785 | $138,600 | $18,100 | $120,500 |
| 2017 | $1,733 | $118,900 | $0 | $0 |
| 2016 | -- | $99,200 | $0 | $0 |
| 2015 | $1,346 | $79,500 | $0 | $0 |
| 2014 | $1,346 | $79,500 | $0 | $0 |
Source: Public Records
Map
Nearby Homes
- 1214 N Division St
- 208 Union Ave
- 810 N Division St
- 313 W London Ave
- 618 Baker St
- 322 Naylor St
- 411 Elizabeth St
- 711 E Church St
- 309 Marshall St
- 611 Lakeside Dr
- 909 Johnson St
- 812 E Church St
- 625 Liberty St
- 403 Rose St
- 923 Preston St
- 208 W Isabella St
- LOT D4 International Dr
- 201 Marshall St
- 309 Gay St
- 608 Decatur Ave
- 1006 N Division St
- 1008 N Division St
- 1000 N Division St
- 1010 N Division St
- 1002 N Division St
- 105 W London Ave
- 104 Brooklyn Ave
- 1003 N Division St
- 1007 N Division St
- 1009 N Division St
- 1001 N Division St
- 928 N Division St
- 1011 N Division St
- 106 Brooklyn Ave
- 1005 N Division St
- 109 W London Ave
- 1013 N Division St
- 1102 N Division St
- 108 Brooklyn Ave
- 1100 N Division St
Your Personal Tour Guide
Ask me questions while you tour the home.