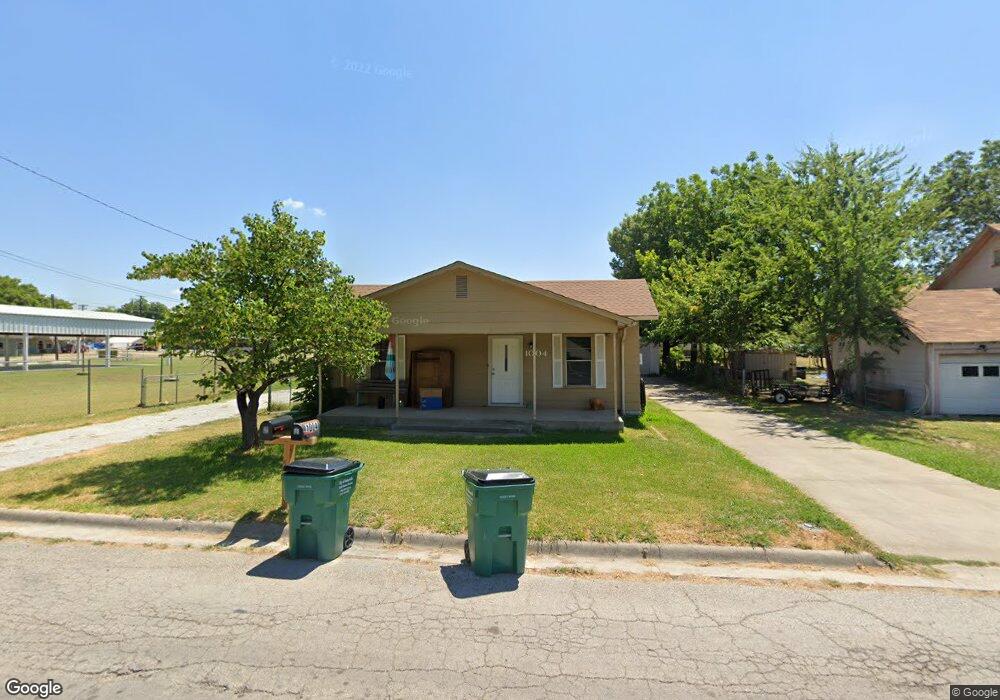
1004 N Morris St Gainesville, TX 76240
Estimated Value: $188,000 - $236,000
3
Beds
2
Baths
1,536
Sq Ft
$139/Sq Ft
Est. Value
About This Home
This home is located at 1004 N Morris St, Gainesville, TX 76240 and is currently estimated at $213,156, approximately $138 per square foot. 1004 N Morris St is a home located in Cooke County with nearby schools including Edison Elementary School, W.E. Chalmers Elementary School, and Gainesville Intermediate School.
Ownership History
Date
Name
Owned For
Owner Type
Purchase Details
Closed on
Jan 25, 2021
Sold by
Overstreet Juliet and Overstreet Kendrick S
Bought by
Manning Investment Group Llc
Current Estimated Value
Home Financials for this Owner
Home Financials are based on the most recent Mortgage that was taken out on this home.
Original Mortgage
$102,000
Interest Rate
2.67%
Mortgage Type
Construction
Purchase Details
Closed on
Feb 27, 2006
Sold by
Johnson Robert and Johnson Rachel
Bought by
Overstreet Jeff
Home Financials for this Owner
Home Financials are based on the most recent Mortgage that was taken out on this home.
Original Mortgage
$68,875
Interest Rate
6.09%
Mortgage Type
New Conventional
Purchase Details
Closed on
Mar 23, 2005
Sold by
The Central Baptist Church Of Gainsville
Bought by
Johnson Robert and Johnson Rachel
Home Financials for this Owner
Home Financials are based on the most recent Mortgage that was taken out on this home.
Original Mortgage
$61,427
Interest Rate
8.4%
Mortgage Type
Adjustable Rate Mortgage/ARM
Create a Home Valuation Report for This Property
The Home Valuation Report is an in-depth analysis detailing your home's value as well as a comparison with similar homes in the area
Home Values in the Area
Average Home Value in this Area
Purchase History
| Date | Buyer | Sale Price | Title Company |
|---|---|---|---|
| Manning Investment Group Llc | -- | Gainesville Title Co Inc | |
| Overstreet Jeff | -- | -- | |
| Johnson Robert | -- | -- |
Source: Public Records
Mortgage History
| Date | Status | Borrower | Loan Amount |
|---|---|---|---|
| Closed | Manning Investment Group Llc | $102,000 | |
| Previous Owner | Overstreet Jeff | $68,875 | |
| Previous Owner | Johnson Robert | $61,427 |
Source: Public Records
Tax History Compared to Growth
Tax History
| Year | Tax Paid | Tax Assessment Tax Assessment Total Assessment is a certain percentage of the fair market value that is determined by local assessors to be the total taxable value of land and additions on the property. | Land | Improvement |
|---|---|---|---|---|
| 2025 | $3,879 | $204,662 | $40,028 | $164,634 |
| 2024 | $3,879 | $204,662 | $40,028 | $164,634 |
| 2023 | $3,815 | $194,437 | $36,390 | $158,047 |
| 2022 | $3,493 | $160,454 | $32,456 | $127,998 |
| 2021 | $1,931 | $75,000 | $21,637 | $53,363 |
| 2020 | $2,824 | $106,334 | $20,654 | $85,680 |
| 2019 | $2,138 | $95,168 | $20,654 | $74,514 |
| 2018 | $1,941 | $71,129 | $8,360 | $62,769 |
| 2017 | $1,854 | $68,182 | $8,360 | $59,822 |
| 2015 | $1,583 | $67,010 | $8,360 | $58,650 |
| 2014 | $1,583 | $66,697 | $8,360 | $58,337 |
Source: Public Records
Map
Nearby Homes
- 802 Myrtle St
- 901 N Morris St
- TBD County Road 208
- 764
- 811 Ritchey St
- 805 Ritchey St
- Lot #2 Belcher St
- Lot #1 Belcher St
- Lot #3 Belcher St
- 1016 N Howeth St
- 1306 N Clements St
- 1305 Hillcrest Blvd
- 1520 Olive St
- 608 Ritchey St
- 605 N Schopmeyer St
- 603 N Schopmeyer St
- 625 Denison St
- 1113 Fair Ave
- 1102 Fair Ave
- 705 Fair Ave
- 1000 N Morris St
- 1003 N Morris St
- 1001 N Morris St
- 916 N Morris St
- 1018 Minnie St
- 914 N Morris St
- 912 N Morris St
- 1037 N Morris St
- 917 N Grand Ave
- 1110 Minnie St
- 720 Myrtle St
- 801 Myrtle St
- 915 N Morris St
- 1031 N Grand Ave
- 1012 Myrtle St
- 908 N Morris St
- 909 N Morris St
- 1039 N Morris St
- 1010 N Taylor St
- 1007 Minnie St