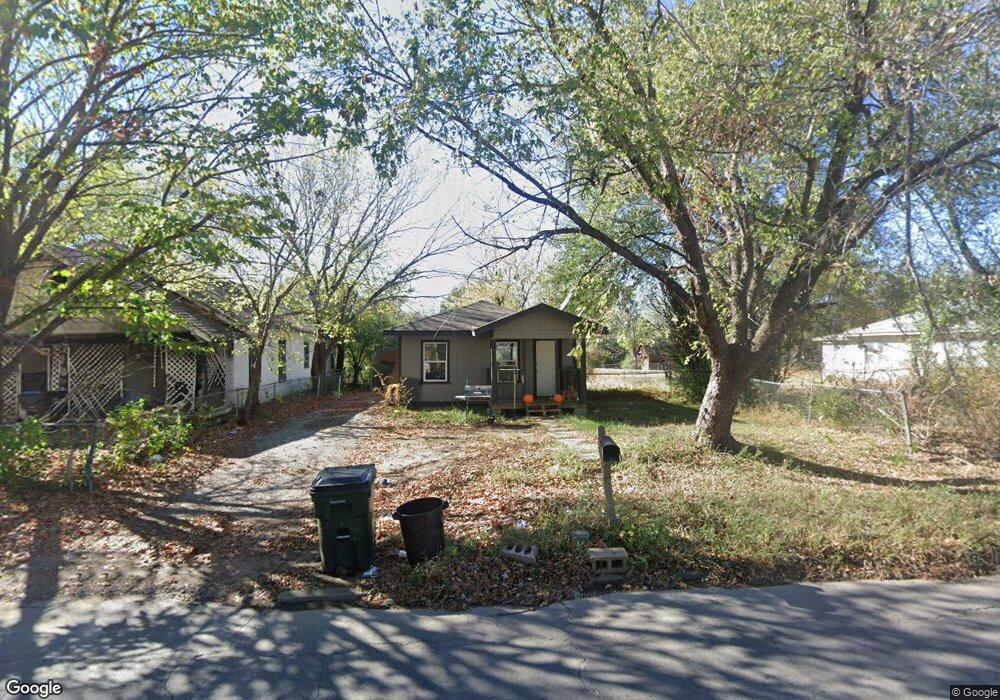
1004 N Oklahoma Ave Okmulgee, OK 74447
Estimated Value: $37,764 - $86,000
2
Beds
1
Bath
551
Sq Ft
$117/Sq Ft
Est. Value
About This Home
This home is located at 1004 N Oklahoma Ave, Okmulgee, OK 74447 and is currently estimated at $64,691, approximately $117 per square foot. 1004 N Oklahoma Ave is a home located in Okmulgee County with nearby schools including Okmulgee Primary School, Okmulgee Middle School, and Dunbar Elementary School.
Ownership History
Date
Name
Owned For
Owner Type
Purchase Details
Closed on
Dec 2, 2021
Sold by
Wendell Mayfield Kevin
Bought by
Key Jeffery
Current Estimated Value
Purchase Details
Closed on
Jun 6, 2019
Sold by
Kc Rental Properties Llc
Bought by
Mayfield Kevin Wendell
Purchase Details
Closed on
Dec 5, 2011
Sold by
Norris Holly N
Bought by
Kell Ronnie and Kell Cynthia
Purchase Details
Closed on
Jun 17, 2009
Sold by
Atkins Robert and Atkins Linda
Bought by
Norris Holly N
Purchase Details
Closed on
Feb 11, 2009
Sold by
Sanders Clyde S and Sanders Billy J
Bought by
Atkins Robert G and Atkins Linda G
Purchase Details
Closed on
Jul 10, 2002
Sold by
Chambers Amanda Larae
Bought by
Sanders Clyde Jr Rev Tr
Purchase Details
Closed on
Jan 18, 1996
Sold by
Porter Charles and Porter June
Bought by
Christian Phyllis Kay
Create a Home Valuation Report for This Property
The Home Valuation Report is an in-depth analysis detailing your home's value as well as a comparison with similar homes in the area
Home Values in the Area
Average Home Value in this Area
Purchase History
| Date | Buyer | Sale Price | Title Company |
|---|---|---|---|
| Key Jeffery | -- | None Listed On Document | |
| Mayfield Kevin Wendell | $7,000 | None Available | |
| Kell Ronnie | -- | None Available | |
| Norris Holly N | $11,000 | None Available | |
| Atkins Robert G | $10,500 | None Available | |
| Sanders Clyde Jr Rev Tr | $13,000 | -- | |
| Christian Phyllis Kay | $12,500 | -- |
Source: Public Records
Tax History Compared to Growth
Tax History
| Year | Tax Paid | Tax Assessment Tax Assessment Total Assessment is a certain percentage of the fair market value that is determined by local assessors to be the total taxable value of land and additions on the property. | Land | Improvement |
|---|---|---|---|---|
| 2025 | $164 | $1,786 | $180 | $1,606 |
| 2024 | $154 | $1,701 | $180 | $1,521 |
| 2023 | $255 | $3,000 | $180 | $2,820 |
| 2022 | $123 | $1,454 | $180 | $1,274 |
| 2021 | $129 | $1,454 | $180 | $1,274 |
| 2020 | $129 | $1,457 | $180 | $1,277 |
| 2019 | $129 | $1,459 | $180 | $1,279 |
| 2018 | $127 | $1,416 | $180 | $1,236 |
| 2017 | $119 | $1,348 | $180 | $1,168 |
| 2016 | $120 | $1,355 | $180 | $1,175 |
| 2015 | $111 | $1,290 | $180 | $1,110 |
| 2014 | $107 | $1,229 | $180 | $1,049 |
Source: Public Records
Map
Nearby Homes
- 910 N Collins Ave
- 908 N Collins Ave
- 0 N Sherman Ave
- 1101 N Collins Ave
- 804 N Griffin Ave
- 1106 N Alabama Ave
- 1026 N Kern Ave
- 804 N Alabama Ave
- 813 N Kern Ave
- 704 N Sherman Ave
- 700 N Sherman Ave
- 602 N Collins Ave
- 1400 W Seneca St
- 530 N Okmulgee Ave
- 1401 N Griffin St
- 809 N Grand Ave
- 305 N Taft Ave
- 130 N Taft Ave
- 0096 State Highway 56
- 400 Yuchi Dr
- 1002 N Oklahoma Ave
- 1010 N Oklahoma Ave
- 926 N Oklahoma Ave
- 1007 N Bryan St
- 1014 N Oklahoma Ave
- 1001 N Oklahoma Ave
- 924 N Oklahoma Ave
- 1009 N Oklahoma Ave
- 1011 N Bryan St
- 1007 N Oklahoma Ave
- 1013 N Oklahoma Ave
- 820 W Belmont St
- 1011 N Oklahoma Ave
- 922 N Oklahoma Ave
- 929 N Oklahoma Ave
- 1024 N Oklahoma Ave
- 822 W Belmont St
- 1023 N Bryan St
- 1015 N Oklahoma Ave
- 1000 N Bryan St