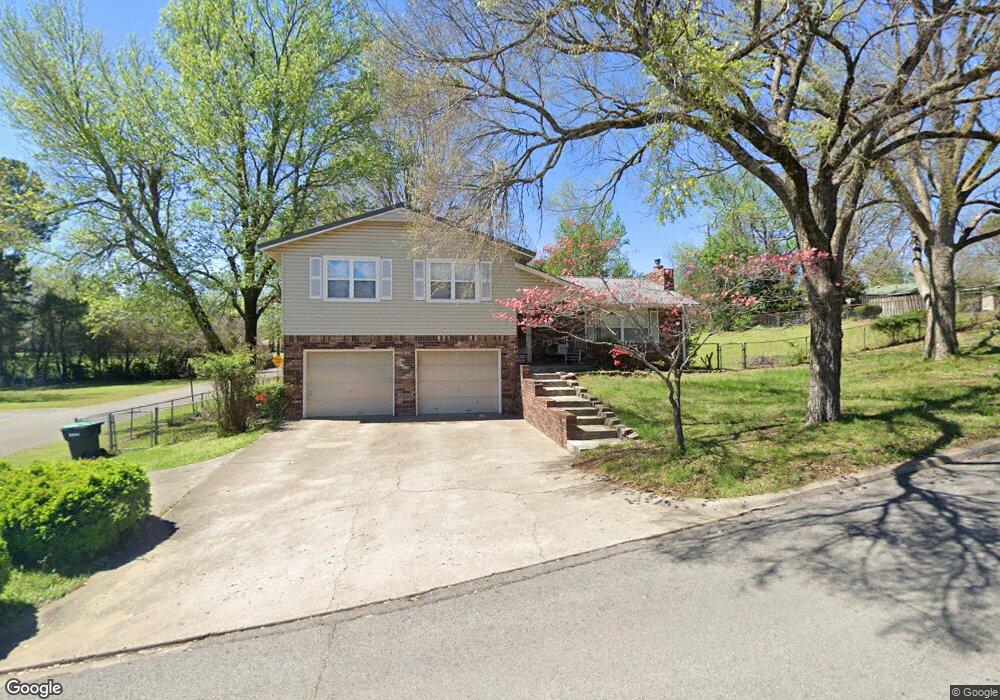
1004 Owens St Tahlequah, OK 74464
Estimated Value: $217,069
3
Beds
2
Baths
1,978
Sq Ft
$110/Sq Ft
Est. Value
About This Home
This home is located at 1004 Owens St, Tahlequah, OK 74464 and is currently priced at $217,069, approximately $109 per square foot. 1004 Owens St is a home located in Cherokee County with nearby schools including Greenwood Elementary School, Cherokee Elementary School, and Tahlequah Middle School.
Ownership History
Date
Name
Owned For
Owner Type
Purchase Details
Closed on
Jul 31, 2025
Sold by
Murray Kyle J and Murray Keisha M
Bought by
Henley Rommy and Henley Kimi
Current Estimated Value
Home Financials for this Owner
Home Financials are based on the most recent Mortgage that was taken out on this home.
Original Mortgage
$168,000
Outstanding Balance
$167,553
Interest Rate
6.63%
Mortgage Type
New Conventional
Purchase Details
Closed on
Feb 27, 2015
Sold by
Murray Kyle J and Murray Keisha M
Bought by
Murray Kyle J and Murray Keisha M
Purchase Details
Closed on
May 22, 2014
Sold by
Jpmorgan Chase Bank Na
Bought by
Murray Kyle J and Murray Keisha M
Home Financials for this Owner
Home Financials are based on the most recent Mortgage that was taken out on this home.
Original Mortgage
$103,662
Interest Rate
4.32%
Mortgage Type
Purchase Money Mortgage
Purchase Details
Closed on
Oct 28, 2013
Sold by
Howe Barbara and Doe John
Bought by
Jpmorgan Chase Bank Na
Purchase Details
Closed on
Feb 16, 2007
Sold by
Rogers Beverly A and Tyrone A Rogers Living Trust
Bought by
Welch Dean and Welch Rita
Create a Home Valuation Report for This Property
The Home Valuation Report is an in-depth analysis detailing your home's value as well as a comparison with similar homes in the area
Home Values in the Area
Average Home Value in this Area
Purchase History
| Date | Buyer | Sale Price | Title Company |
|---|---|---|---|
| Henley Rommy | $210,000 | Infinity Title | |
| Murray Kyle J | -- | None Available | |
| Murray Kyle J | $92,500 | None Available | |
| Jpmorgan Chase Bank Na | $105,940 | None Available | |
| Welch Dean | $136,500 | Lahlequah Abstract Closing S |
Source: Public Records
Mortgage History
| Date | Status | Borrower | Loan Amount |
|---|---|---|---|
| Open | Henley Rommy | $168,000 | |
| Previous Owner | Murray Kyle J | $103,662 |
Source: Public Records
Tax History Compared to Growth
Tax History
| Year | Tax Paid | Tax Assessment Tax Assessment Total Assessment is a certain percentage of the fair market value that is determined by local assessors to be the total taxable value of land and additions on the property. | Land | Improvement |
|---|---|---|---|---|
| 2025 | $1,424 | $15,244 | $2,750 | $12,494 |
| 2024 | $1,477 | $15,588 | $2,750 | $12,838 |
| 2023 | $1,477 | $16,629 | $1,210 | $15,419 |
| 2022 | $1,543 | $16,629 | $1,210 | $15,419 |
| 2021 | $1,548 | $16,629 | $1,210 | $15,419 |
| 2020 | $1,576 | $16,629 | $1,210 | $15,419 |
| 2019 | $1,533 | $16,312 | $1,210 | $15,102 |
| 2018 | $1,477 | $15,536 | $1,210 | $14,326 |
| 2017 | $1,466 | $15,449 | $1,210 | $14,239 |
| 2016 | $1,405 | $14,714 | $1,210 | $13,504 |
| 2015 | $1,520 | $14,013 | $1,210 | $12,803 |
| 2014 | $1,520 | $16,143 | $1,210 | $14,933 |
Source: Public Records
Map
Nearby Homes
- 902 S Owens Ave
- 902 S Mission Ave
- 1104 Chase Ave
- 1025 W Fox St
- 516 W Fox St
- 802 S College Ave
- 513 S State Ave
- 510 S Cherokee Ave
- Tbd Unit West Fox Street Tahl
- 757 S Bluff Ave
- 1500 Stickross Mountain Rd
- TBD W Fox St
- 306 Short St
- 224 W Chickasaw St
- 807 W Choctaw St
- 0 W Choctaw St
- 813 W Choctaw St
- 1700 Stickross Mountain Rd
- 201 Sandy Cir
- 702 Wilson Ave