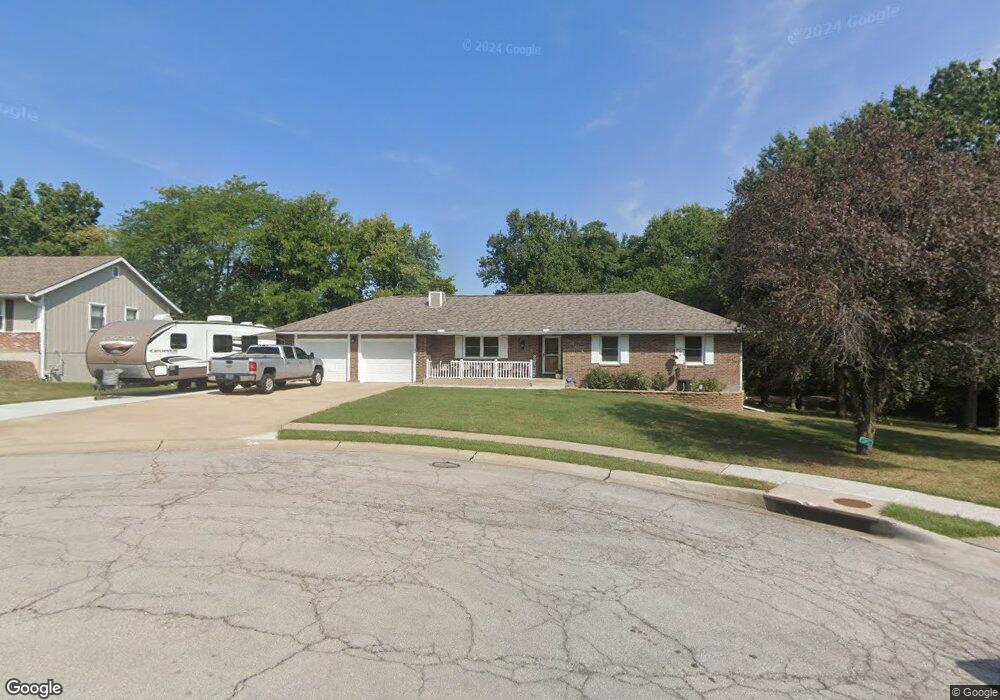
1004 Parkridge St Harrisonville, MO 64701
Estimated Value: $284,000 - $331,000
4
Beds
3
Baths
1,482
Sq Ft
$209/Sq Ft
Est. Value
About This Home
This home is located at 1004 Parkridge St, Harrisonville, MO 64701 and is currently estimated at $309,383, approximately $208 per square foot. 1004 Parkridge St is a home located in Cass County with nearby schools including Harrisonville Elementary School, McEowen Elementary School, and Harrisonville Middle School.
Ownership History
Date
Name
Owned For
Owner Type
Purchase Details
Closed on
Sep 4, 2009
Sold by
Burns Michael James
Bought by
Chancellor Kenneth N and Chancellor Cindy
Current Estimated Value
Home Financials for this Owner
Home Financials are based on the most recent Mortgage that was taken out on this home.
Original Mortgage
$132,300
Outstanding Balance
$86,568
Interest Rate
5.2%
Mortgage Type
New Conventional
Estimated Equity
$222,815
Purchase Details
Closed on
Feb 21, 2008
Sold by
Burns Leslee Belle
Purchase Details
Closed on
Jan 12, 2007
Sold by
Frey Thomas C
Bought by
Burns Michael J and Burns Leslee B
Home Financials for this Owner
Home Financials are based on the most recent Mortgage that was taken out on this home.
Original Mortgage
$188,510
Interest Rate
6.1%
Mortgage Type
FHA
Purchase Details
Closed on
Jul 21, 2006
Sold by
Frey Constance L
Bought by
Frey Thomas C
Create a Home Valuation Report for This Property
The Home Valuation Report is an in-depth analysis detailing your home's value as well as a comparison with similar homes in the area
Home Values in the Area
Average Home Value in this Area
Purchase History
| Date | Buyer | Sale Price | Title Company |
|---|---|---|---|
| Chancellor Kenneth N | -- | None Available | |
| -- | -- | -- | |
| Burns Michael J | -- | -- | |
| Frey Thomas C | -- | -- |
Source: Public Records
Mortgage History
| Date | Status | Borrower | Loan Amount |
|---|---|---|---|
| Open | Chancellor Kenneth N | $132,300 | |
| Previous Owner | Burns Michael J | $188,510 |
Source: Public Records
Tax History Compared to Growth
Tax History
| Year | Tax Paid | Tax Assessment Tax Assessment Total Assessment is a certain percentage of the fair market value that is determined by local assessors to be the total taxable value of land and additions on the property. | Land | Improvement |
|---|---|---|---|---|
| 2024 | $2,325 | $34,440 | $4,550 | $29,890 |
| 2023 | $2,312 | $34,440 | $4,550 | $29,890 |
| 2022 | $2,071 | $30,500 | $4,550 | $25,950 |
| 2021 | $2,071 | $30,500 | $4,550 | $25,950 |
| 2020 | $1,985 | $29,320 | $4,550 | $24,770 |
| 2019 | $1,838 | $29,320 | $4,550 | $24,770 |
| 2018 | $1,669 | $26,410 | $4,000 | $22,410 |
| 2017 | $1,579 | $26,410 | $4,000 | $22,410 |
| 2016 | $1,579 | $24,810 | $4,000 | $20,810 |
| 2015 | $1,579 | $24,810 | $4,000 | $20,810 |
| 2014 | $1,580 | $24,810 | $4,000 | $20,810 |
| 2013 | -- | $24,810 | $4,000 | $20,810 |
Source: Public Records
Map
Nearby Homes
- 1105 N Halsey Ave
- 805 Ash St
- 701 & 703 Cass St
- 307 N Bradley Ave
- 2004 Maverick Trail
- 1006 E Pearl St
- 2100 Thunderbird Dr
- 705 Galaxie Ave
- 1402 Norfolk Dr
- 204 S Price Ave
- 104 W Pearl St
- 2313 Burris Dr
- 603 S Independence St
- 616 Silver Maple Dr
- 105 Brookridge Dr Unit 107
- 2201 Twin Oaks Dr
- 902 Twin Oaks Terrace
- 2203 Twin Oaks Dr
- 904 Twin Oaks Terrace
- 1000 Twin Oaks Terrace
- 1002 Parkridge St
- 1005 Parkridge St
- 1000 Parkridge St
- 1009 N King Ave
- 1003 Parkridge St
- 916 Parkridge St
- 1007 N King Ave
- 914 Parkridge St
- 1005 N King Ave
- 909 Parkridge St
- 1004 N King Ave
- 1003 N King Ave
- 910 Parkridge St
- 907 Parkridge St
- 1002 N King Ave
- 908 Parkridge St
- 1100 Ash St
- 905 Parkridge St
- 1102 Ash St
- 1010 Ash St