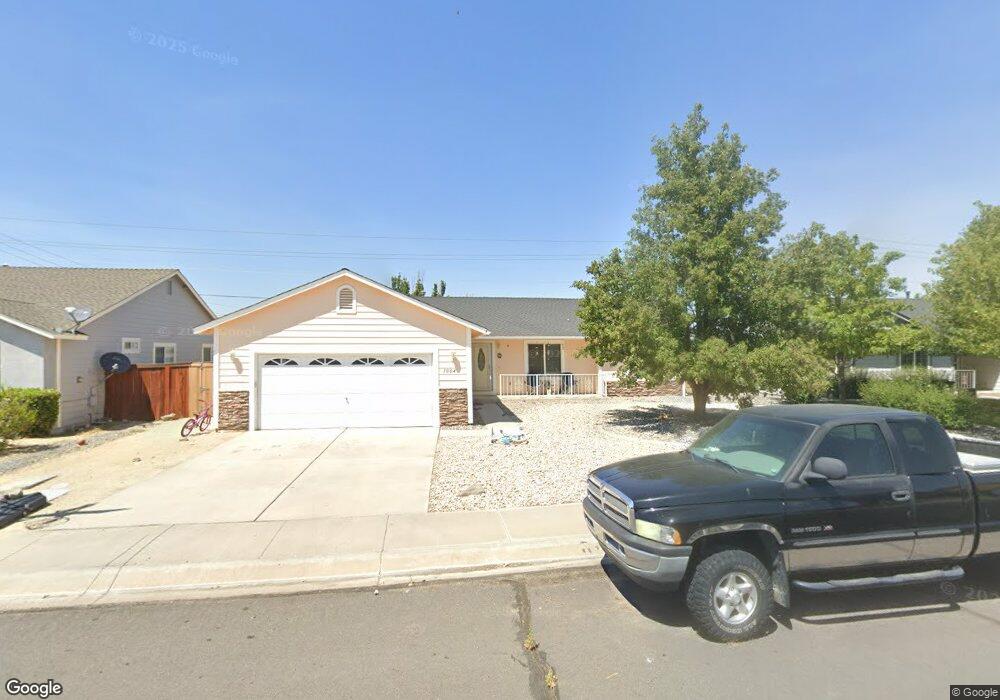
1004 Pepper Ln Fernley, NV 89408
Estimated Value: $353,469 - $383,000
3
Beds
2
Baths
1,526
Sq Ft
$240/Sq Ft
Est. Value
About This Home
This home is located at 1004 Pepper Ln, Fernley, NV 89408 and is currently estimated at $366,867, approximately $240 per square foot. 1004 Pepper Ln is a home located in Lyon County with nearby schools including East Valley Elementary School, Fernley Intermediate School, and Fernley High School.
Ownership History
Date
Name
Owned For
Owner Type
Purchase Details
Closed on
Feb 13, 2017
Sold by
Kathman Eric J
Bought by
Myers Kirby
Current Estimated Value
Home Financials for this Owner
Home Financials are based on the most recent Mortgage that was taken out on this home.
Original Mortgage
$156,000
Outstanding Balance
$128,871
Interest Rate
4.12%
Mortgage Type
New Conventional
Estimated Equity
$237,996
Purchase Details
Closed on
Dec 26, 2007
Sold by
Wells Fargo Financial Nevada 2 Inc
Bought by
Kathman Eric J
Home Financials for this Owner
Home Financials are based on the most recent Mortgage that was taken out on this home.
Original Mortgage
$169,900
Interest Rate
6.21%
Mortgage Type
Purchase Money Mortgage
Purchase Details
Closed on
Nov 2, 2007
Sold by
Neace Noah S and Neace Cheryl A
Bought by
Wells Fargo Financial Nevada 2 Inc
Home Financials for this Owner
Home Financials are based on the most recent Mortgage that was taken out on this home.
Original Mortgage
$169,900
Interest Rate
6.21%
Mortgage Type
Purchase Money Mortgage
Create a Home Valuation Report for This Property
The Home Valuation Report is an in-depth analysis detailing your home's value as well as a comparison with similar homes in the area
Home Values in the Area
Average Home Value in this Area
Purchase History
| Date | Buyer | Sale Price | Title Company |
|---|---|---|---|
| Myers Kirby | $195,000 | Western Title Co | |
| Kathman Eric J | $169,900 | Title Service & Escrow Co | |
| Wells Fargo Financial Nevada 2 Inc | $165,000 | First Centennial Carson |
Source: Public Records
Mortgage History
| Date | Status | Borrower | Loan Amount |
|---|---|---|---|
| Open | Myers Kirby | $156,000 | |
| Previous Owner | Kathman Eric J | $169,900 |
Source: Public Records
Tax History Compared to Growth
Tax History
| Year | Tax Paid | Tax Assessment Tax Assessment Total Assessment is a certain percentage of the fair market value that is determined by local assessors to be the total taxable value of land and additions on the property. | Land | Improvement |
|---|---|---|---|---|
| 2025 | $1,535 | $92,179 | $38,500 | $53,679 |
| 2024 | $1,900 | $92,559 | $38,500 | $54,059 |
| 2023 | $1,900 | $89,400 | $38,500 | $50,900 |
| 2022 | $1,795 | $85,639 | $38,500 | $47,139 |
| 2021 | $1,779 | $79,276 | $33,250 | $46,026 |
| 2020 | $1,735 | $77,311 | $33,250 | $44,061 |
| 2019 | $1,712 | $65,429 | $22,750 | $42,679 |
| 2018 | $1,678 | $59,168 | $17,500 | $41,668 |
| 2017 | $1,674 | $53,969 | $12,250 | $41,719 |
| 2016 | $1,487 | $44,974 | $4,380 | $40,594 |
| 2015 | $1,522 | $37,762 | $4,380 | $33,382 |
| 2014 | $1,488 | $30,360 | $4,380 | $25,980 |
Source: Public Records
Map
Nearby Homes
- 151 Desert Springs Ln
- 1063 Pepper Ln Unit 192
- 231 Poppy Hills Dr
- 751 Divot Dr
- 165 Desert Springs Ln
- 1103 Dixie Ln
- 231 Amber Ct
- 763 Divot Dr
- 1129 Dixie Ln
- 1498 Slice Cir
- 770 Divot Dr
- 239 Mary Lou Ln
- 288 Fallen Leaf Ln
- 240 Mary Lou Ln
- 777 Divot Dr
- 1610 Mary Ct
- 203 Mary Lou Ln
- 1304 Serenity Cir Unit LOT 24
- 1310 Serenity Cir Unit LOT 21
- 326 Bens Way
- 1002 Pepper Ln
- 1006 Pepper Ln
- 1008 Pepper Ln
- 1000 Pepper Ln
- 1005 Pepper Ln
- 1007 Pepper Ln
- 1003 Pepper Ln
- 1009 Pepper Ln
- 1010 Pepper Ln
- 1001 Pepper Ln
- 1011 Pepper Ln
- 1012 Pepper Ln
- 907 Julia Ln
- 900 Julia Ln Unit at golf course
- 900 Julia Ln Unit GOLF COURSE
- 900 Julia Ln
- 898 Julia Ln
- 902 Julia Ln
- 1013 Pepper Ln
- 904 Julia Ln