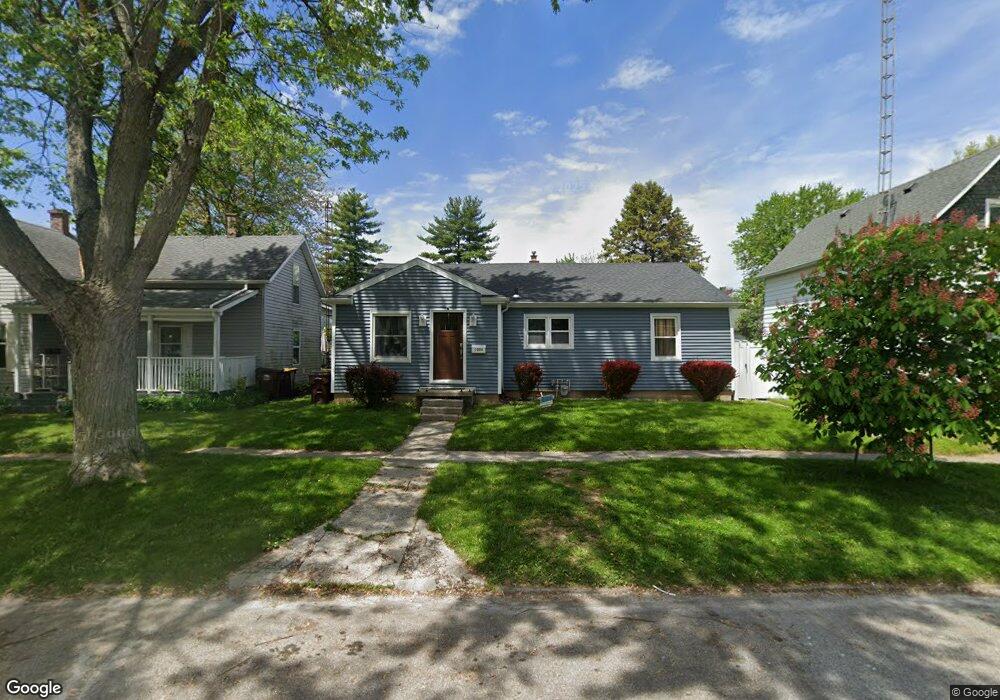
1004 Riverside Ave Defiance, OH 43512
Estimated Value: $116,000 - $150,000
3
Beds
1
Bath
1,264
Sq Ft
$100/Sq Ft
Est. Value
About This Home
This home is located at 1004 Riverside Ave, Defiance, OH 43512 and is currently estimated at $126,067, approximately $99 per square foot. 1004 Riverside Ave is a home located in Defiance County with nearby schools including Defiance Elementary School, Defiance Middle School, and Defiance High School.
Ownership History
Date
Name
Owned For
Owner Type
Purchase Details
Closed on
Aug 25, 2020
Sold by
Lomeli Tamar R and Pina Jose
Bought by
Lomeli Tamar R and Pina Jose
Current Estimated Value
Home Financials for this Owner
Home Financials are based on the most recent Mortgage that was taken out on this home.
Original Mortgage
$66,500
Outstanding Balance
$47,455
Interest Rate
2.9%
Mortgage Type
New Conventional
Estimated Equity
$78,612
Purchase Details
Closed on
Oct 6, 2009
Sold by
Gabrie Yamal
Bought by
Lomeli Tamar R and Gabrie Tamar R
Purchase Details
Closed on
Jun 6, 2007
Sold by
Hedrick George W and Hedrick Elizabeth
Bought by
Gabrie Yamal and Gabrie Tamar
Home Financials for this Owner
Home Financials are based on the most recent Mortgage that was taken out on this home.
Original Mortgage
$71,300
Interest Rate
6.21%
Mortgage Type
New Conventional
Create a Home Valuation Report for This Property
The Home Valuation Report is an in-depth analysis detailing your home's value as well as a comparison with similar homes in the area
Home Values in the Area
Average Home Value in this Area
Purchase History
| Date | Buyer | Sale Price | Title Company |
|---|---|---|---|
| Lomeli Tamar R | -- | None Available | |
| Lomeli Tamar R | -- | -- | |
| Gabrie Yamal | $53,475 | -- |
Source: Public Records
Mortgage History
| Date | Status | Borrower | Loan Amount |
|---|---|---|---|
| Open | Lomeli Tamar R | $66,500 | |
| Closed | Gabrie Yamal | $71,300 |
Source: Public Records
Tax History Compared to Growth
Tax History
| Year | Tax Paid | Tax Assessment Tax Assessment Total Assessment is a certain percentage of the fair market value that is determined by local assessors to be the total taxable value of land and additions on the property. | Land | Improvement |
|---|---|---|---|---|
| 2024 | $1,222 | $32,540 | $3,290 | $29,250 |
| 2023 | $1,222 | $32,540 | $3,290 | $29,250 |
| 2022 | $1,057 | $25,070 | $3,290 | $21,780 |
| 2021 | $1,057 | $25,120 | $3,290 | $21,830 |
| 2020 | $1,065 | $25,120 | $3,290 | $21,830 |
| 2019 | $967 | $22,330 | $3,290 | $19,040 |
| 2018 | $941 | $22,330 | $3,290 | $19,040 |
| 2017 | $918 | $22,334 | $3,290 | $19,044 |
| 2016 | $927 | $21,644 | $3,150 | $18,494 |
| 2015 | $446 | $21,644 | $3,150 | $18,494 |
| 2014 | $446 | $21,644 | $3,150 | $18,494 |
| 2013 | $446 | $21,644 | $3,150 | $18,494 |
| 2012 | $446 | $21,644 | $3,150 | $18,494 |
Source: Public Records
Map
Nearby Homes
- 1101 Jefferson Ave
- 8627 Ohio 66
- 00 Melody Ln
- 1211 Powell View Dr
- 825 S Clinton St
- 668 Jefferson Ave
- 156 Cleveland Ave
- 643 S Clinton St
- 412 Rulf St
- 222 Hopkins St
- 511 Haig St
- 1624 Woodhurst Dr
- 411 Auglaize St
- 420 Highland St
- 319 East St
- 1623 Evan Dr
- 14631 Ohio 15
- 336 Holgate Ave
- 1819 Sherwood Dr
- 1301 Ottawa Ave
- 1000 Riverside Ave
- 1010 Riverside Ave
- 1014 Riverside Ave
- 1001 Washington Ave
- 954 Riverside Ave
- 1016 Riverside Ave
- 1011 Washington Ave
- 946 Riverside Ave
- 1013 Washington Ave
- 951 Washington Ave
- 1003 Riverside Ave
- 1016 1/2 Riverside Ave
- 1015 Washington Ave
- 942 Riverside Ave
- 949 Washington Ave
- 999 Riverside Ave
- 1017 Washington Ave
- 943 Washington Ave
- 1024 Riverside Ave
- 938 Riverside Ave