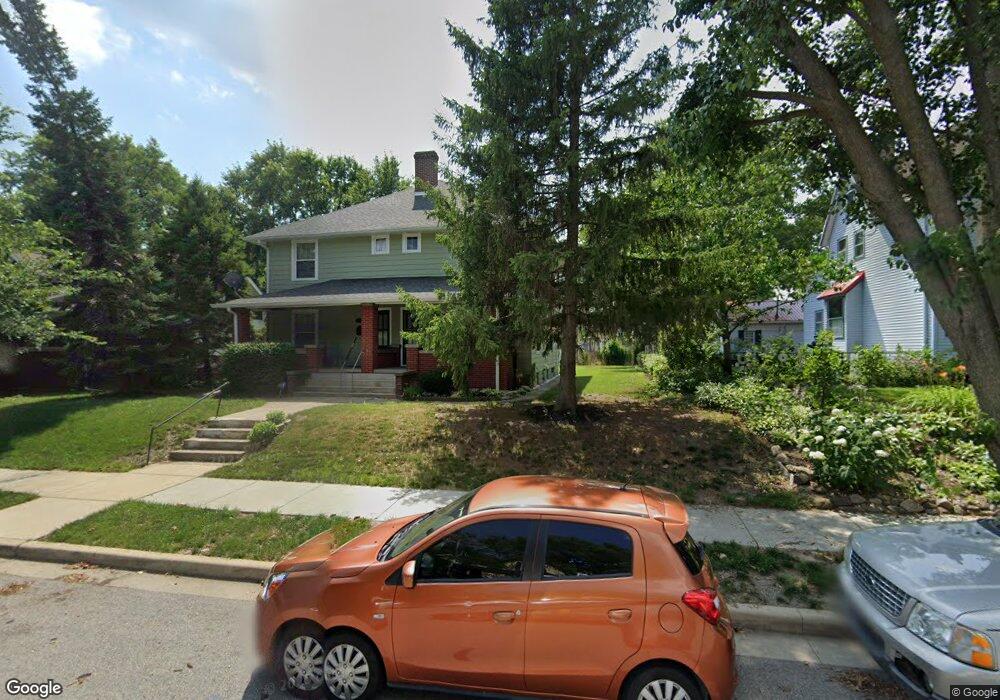
1004 S 11th St Unit 6 Lafayette, IN 47905
Central NeighborhoodEstimated Value: $271,000 - $280,000
--
Bed
3
Baths
2,204
Sq Ft
$125/Sq Ft
Est. Value
About This Home
This home is located at 1004 S 11th St Unit 6, Lafayette, IN 47905 and is currently estimated at $275,500, approximately $125 per square foot. 1004 S 11th St Unit 6 is a home located in Tippecanoe County with nearby schools including Oakland Elementary School, Lafayette Tecumseh Junior High School, and Sunnyside Intermediate School.
Ownership History
Date
Name
Owned For
Owner Type
Purchase Details
Closed on
Oct 28, 2025
Sold by
Kologinsky Kevin W and Kologinsky Kathleen A
Bought by
Best Baylee Kay and Best James Hayden
Current Estimated Value
Home Financials for this Owner
Home Financials are based on the most recent Mortgage that was taken out on this home.
Original Mortgage
$336,000
Outstanding Balance
$336,000
Interest Rate
6.26%
Mortgage Type
New Conventional
Estimated Equity
-$60,500
Purchase Details
Closed on
Dec 22, 2006
Sold by
Petgen Matthew D
Bought by
Kologinsky Kevin W and Kologinsky Kathleen A
Purchase Details
Closed on
Jun 2, 2003
Sold by
Kuebler Carol J
Bought by
Petgen Matthew D
Home Financials for this Owner
Home Financials are based on the most recent Mortgage that was taken out on this home.
Original Mortgage
$128,150
Interest Rate
5.78%
Mortgage Type
FHA
Create a Home Valuation Report for This Property
The Home Valuation Report is an in-depth analysis detailing your home's value as well as a comparison with similar homes in the area
Home Values in the Area
Average Home Value in this Area
Purchase History
| Date | Buyer | Sale Price | Title Company |
|---|---|---|---|
| Best Baylee Kay | -- | Bcks Title Company | |
| Kologinsky Kevin W | -- | None Available | |
| Petgen Matthew D | -- | -- |
Source: Public Records
Mortgage History
| Date | Status | Borrower | Loan Amount |
|---|---|---|---|
| Open | Best Baylee Kay | $336,000 | |
| Previous Owner | Petgen Matthew D | $128,150 |
Source: Public Records
Tax History Compared to Growth
Tax History
| Year | Tax Paid | Tax Assessment Tax Assessment Total Assessment is a certain percentage of the fair market value that is determined by local assessors to be the total taxable value of land and additions on the property. | Land | Improvement |
|---|---|---|---|---|
| 2024 | $3,677 | $183,800 | $26,000 | $157,800 |
| 2023 | $2,339 | $116,900 | $26,000 | $90,900 |
| 2022 | $2,271 | $113,500 | $26,000 | $87,500 |
| 2021 | $2,227 | $111,300 | $26,000 | $85,300 |
| 2020 | $2,227 | $111,300 | $26,000 | $85,300 |
| 2019 | $2,227 | $111,300 | $30,000 | $81,300 |
| 2018 | $2,227 | $111,300 | $30,000 | $81,300 |
| 2017 | $2,168 | $108,300 | $30,000 | $78,300 |
| 2016 | $2,145 | $107,220 | $30,000 | $77,220 |
| 2014 | $2,040 | $101,900 | $30,000 | $71,900 |
| 2013 | $1,938 | $96,800 | $30,000 | $66,800 |
Source: Public Records
Map
Nearby Homes