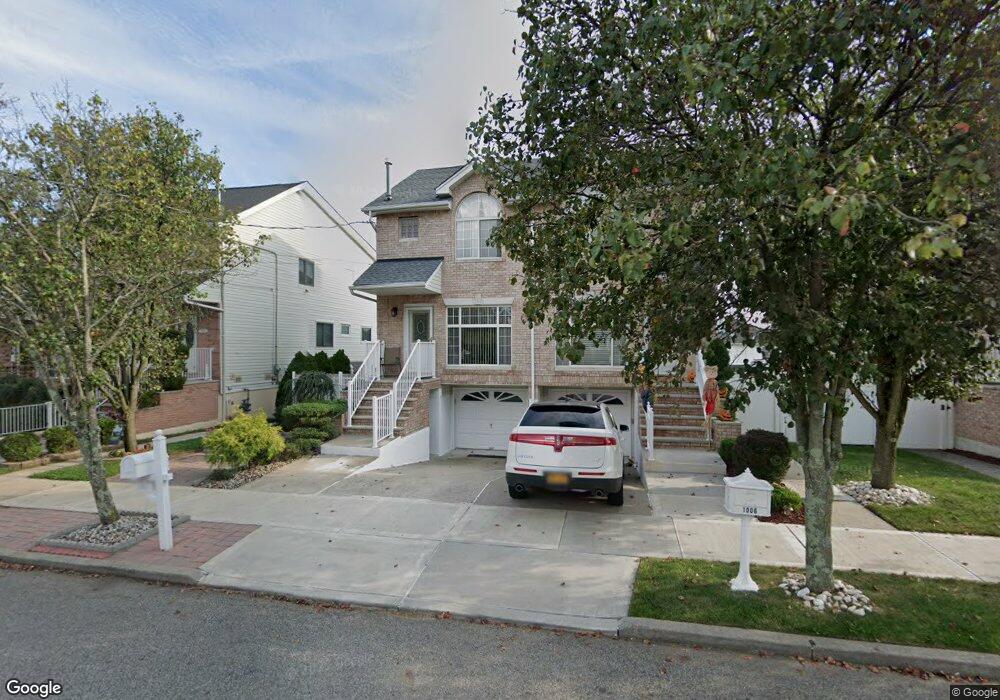
1004 Sheldon Ave Staten Island, NY 10309
Woodrow NeighborhoodEstimated Value: $821,528 - $891,000
3
Beds
3
Baths
1,960
Sq Ft
$437/Sq Ft
Est. Value
About This Home
This home is located at 1004 Sheldon Ave, Staten Island, NY 10309 and is currently estimated at $857,132, approximately $437 per square foot. 1004 Sheldon Ave is a home located in Richmond County with nearby schools including Kathleen Grimm School For Leadership, P.S. 3 - The Margaret Gioiosa School, and Is 34 Tottenville.
Ownership History
Date
Name
Owned For
Owner Type
Purchase Details
Closed on
Aug 7, 2009
Sold by
Parga Denise and Falletta Denise
Bought by
Kuang Yong and Mai Zhuchang
Current Estimated Value
Home Financials for this Owner
Home Financials are based on the most recent Mortgage that was taken out on this home.
Original Mortgage
$100,000
Outstanding Balance
$65,134
Interest Rate
5.19%
Mortgage Type
New Conventional
Estimated Equity
$791,998
Purchase Details
Closed on
Dec 29, 2000
Sold by
Corso Elena
Bought by
Falletta Denise
Home Financials for this Owner
Home Financials are based on the most recent Mortgage that was taken out on this home.
Original Mortgage
$236,800
Interest Rate
7.39%
Purchase Details
Closed on
Apr 22, 1999
Sold by
Sleepy Hollow Development Corp
Bought by
Corso Elena
Home Financials for this Owner
Home Financials are based on the most recent Mortgage that was taken out on this home.
Original Mortgage
$168,000
Interest Rate
7.19%
Create a Home Valuation Report for This Property
The Home Valuation Report is an in-depth analysis detailing your home's value as well as a comparison with similar homes in the area
Home Values in the Area
Average Home Value in this Area
Purchase History
| Date | Buyer | Sale Price | Title Company |
|---|---|---|---|
| Kuang Yong | $468,000 | None Available | |
| Falletta Denise | $296,000 | Washington Title | |
| Corso Elena | $243,500 | Security Title Guaranty Co |
Source: Public Records
Mortgage History
| Date | Status | Borrower | Loan Amount |
|---|---|---|---|
| Open | Kuang Yong | $100,000 | |
| Previous Owner | Falletta Denise | $236,800 | |
| Previous Owner | Corso Elena | $168,000 | |
| Closed | Falletta Denise | $236,800 |
Source: Public Records
Tax History Compared to Growth
Tax History
| Year | Tax Paid | Tax Assessment Tax Assessment Total Assessment is a certain percentage of the fair market value that is determined by local assessors to be the total taxable value of land and additions on the property. | Land | Improvement |
|---|---|---|---|---|
| 2025 | $8,043 | $46,800 | $7,989 | $38,811 |
| 2024 | $8,043 | $42,840 | $8,413 | $34,427 |
| 2023 | $7,672 | $37,778 | $7,331 | $30,447 |
| 2022 | $6,765 | $42,000 | $9,000 | $33,000 |
| 2021 | $7,410 | $38,700 | $9,000 | $29,700 |
| 2020 | $7,328 | $34,620 | $9,000 | $25,620 |
| 2019 | $6,981 | $36,420 | $9,000 | $27,420 |
| 2018 | $6,418 | $31,482 | $8,388 | $23,094 |
| 2017 | $6,054 | $29,700 | $9,000 | $20,700 |
| 2016 | $5,865 | $29,340 | $9,000 | $20,340 |
| 2015 | $5,711 | $29,760 | $7,620 | $22,140 |
| 2014 | $5,711 | $29,760 | $7,620 | $22,140 |
Source: Public Records
Map
Nearby Homes
- 1024 Rensselaer Ave
- 1015 Rathbun Ave
- 980 Rensselaer Ave
- 973 Sheldon Ave
- 630 Ramona Ave
- 963 Sinclair Ave
- 987 Ionia Ave
- 124 Santa Monica Ln
- 1051 Edgegrove Ave
- 1047 Edgegrove Ave
- 265 Ramapo Ave
- 22 El Camino Loop
- 45 Lenevar Ave
- 859 Rathbun Ave
- 880 Sinclair Ave
- 108 Wieland Ave
- 106 Wieland Ave
- 104 Wieland Ave
- 867 Sinclair Ave
- 634 Darlington Ave
- 1002 Sheldon Ave
- 1006 Sheldon Ave
- 1000 Sheldon Ave
- 1012 Sheldon Ave
- 1025 Rensselaer Ave
- 1027 Rensselaer Ave
- 1016 Sheldon Ave
- 1023 Rensselaer Ave
- 1031 Rensselaer Ave
- 1021 Rensselaer Ave
- 1033 Rensselaer Ave
- 1018 Sheldon Ave
- 1035 Rensselaer Ave
- 1007 Sheldon Ave
- 1003 Sheldon Ave
- 1001-1007 Sheldon Ave
- 1022 Sheldon Ave
- 1009 Sheldon Ave
- 1037 Rensselaer Ave