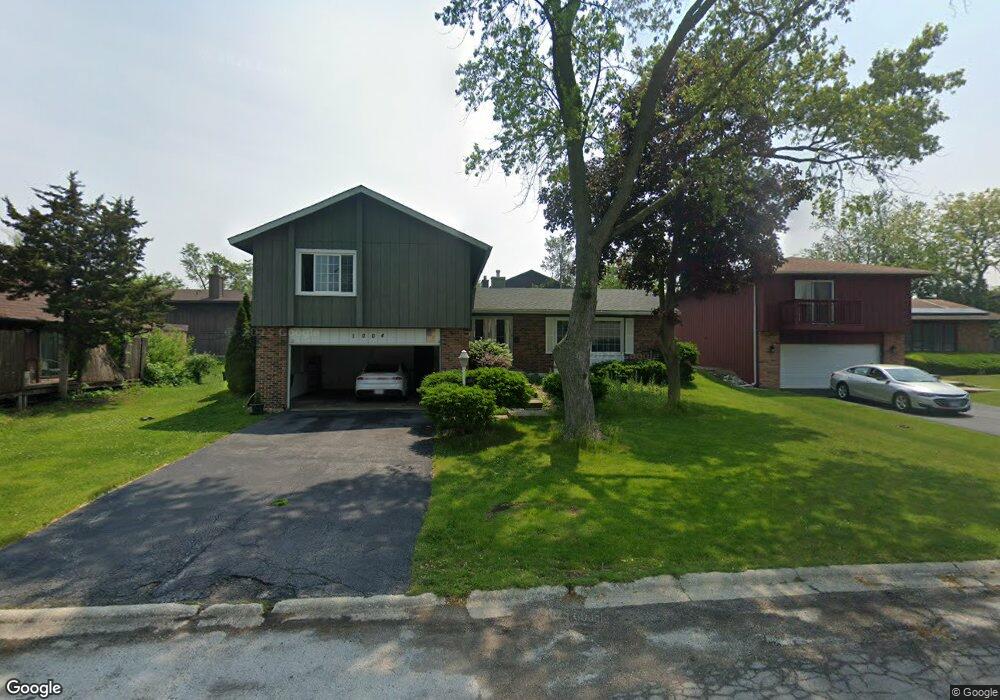
1004 Sierra Ct University Park, IL 60484
Estimated Value: $158,000 - $250,671
3
Beds
2
Baths
2,069
Sq Ft
$104/Sq Ft
Est. Value
About This Home
This home is located at 1004 Sierra Ct, University Park, IL 60484 and is currently estimated at $214,168, approximately $103 per square foot. 1004 Sierra Ct is a home located in Will County with nearby schools including Monee Elementary School, Crete-Monee Middle School, and Crete-Monee High School.
Ownership History
Date
Name
Owned For
Owner Type
Purchase Details
Closed on
Mar 10, 2009
Sold by
Secretary Of Veterans Affairs
Bought by
Bond Fulton and Brown Marilyn
Current Estimated Value
Home Financials for this Owner
Home Financials are based on the most recent Mortgage that was taken out on this home.
Original Mortgage
$69,900
Interest Rate
4.83%
Mortgage Type
VA
Purchase Details
Closed on
Jun 9, 2008
Sold by
Burks Cedric F and Washington Mutual Bank
Bought by
Va
Purchase Details
Closed on
Mar 12, 2008
Sold by
Burks Cedric F and Burks Cedric
Bought by
Washington Mutual Bank and Washington Mutual Bank Fa
Purchase Details
Closed on
Jul 11, 2000
Sold by
Anderson Noel and Anderson Avril A
Bought by
Burks Cedric F and Burks Christine
Home Financials for this Owner
Home Financials are based on the most recent Mortgage that was taken out on this home.
Original Mortgage
$124,440
Interest Rate
8.31%
Mortgage Type
VA
Create a Home Valuation Report for This Property
The Home Valuation Report is an in-depth analysis detailing your home's value as well as a comparison with similar homes in the area
Home Values in the Area
Average Home Value in this Area
Purchase History
| Date | Buyer | Sale Price | Title Company |
|---|---|---|---|
| Bond Fulton | -- | 1St American Title | |
| Va | -- | None Available | |
| Washington Mutual Bank | $154,228 | None Available | |
| Burks Cedric F | $122,000 | -- |
Source: Public Records
Mortgage History
| Date | Status | Borrower | Loan Amount |
|---|---|---|---|
| Previous Owner | Bond Fulton | $69,900 | |
| Previous Owner | Burks Cedric F | $124,440 |
Source: Public Records
Tax History Compared to Growth
Tax History
| Year | Tax Paid | Tax Assessment Tax Assessment Total Assessment is a certain percentage of the fair market value that is determined by local assessors to be the total taxable value of land and additions on the property. | Land | Improvement |
|---|---|---|---|---|
| 2024 | -- | $61,735 | $8,402 | $53,333 |
| 2023 | -- | $53,220 | $7,243 | $45,977 |
| 2022 | $0 | $46,815 | $6,371 | $40,444 |
| 2021 | $0 | $42,629 | $5,852 | $36,777 |
| 2020 | $3,897 | $41,247 | $5,662 | $35,585 |
| 2019 | $3,897 | $39,115 | $5,369 | $33,746 |
| 2018 | $0 | $37,602 | $5,255 | $32,347 |
| 2017 | $3,897 | $35,915 | $5,138 | $30,777 |
| 2016 | $3,897 | $33,996 | $4,941 | $29,055 |
| 2015 | $3,636 | $31,036 | $4,503 | $26,533 |
| 2014 | $3,636 | $30,608 | $4,441 | $26,167 |
| 2013 | $3,636 | $32,050 | $4,650 | $27,400 |
Source: Public Records
Map
Nearby Homes
- 607 Sullivan Ln
- 740 Mission St
- 608 Sullivan Ln
- 537 Nathan Rd
- 1031 Blackhawk Dr
- 662 Sullivan Ln
- 655 Sullivan Ln
- 1039 Barrow Ct
- 903 Blackhawk Dr
- 543 Regent Rd
- 815 Blackhawk Dr
- 882 White Oak Ln Unit 3
- 1109 Abbot Ln
- 807 Blackhawk Dr
- 612 Hickok Ave
- 1039 Abbot Ln
- 912 Cordoba Ct
- 610 Sandra Dr
- 735 Union Dr
- 613 Farmview Rd
- 1008 Sierra Ct
- 617 Hickok Ln
- 1027 Monterey Ct
- 615 Hickok Ln
- 1012 Sierra Ct
- 1029 Monterey Ct
- 1003 Sierra Ct
- 613 Hickok Ln
- 1005 Sierra Ct
- 619 Hickok Ln
- 1016 Sierra Ct
- 1025 Monterey Ct
- 1035 Monterey Ct
- 1023 Monterey Ct
- 1031 Monterey Ct
- 618 Hickok Ln
- 616 Hickok Ave
- 616 Hickok Ln
- 1011 Sierra Ct
- 1007 Sierra Ct