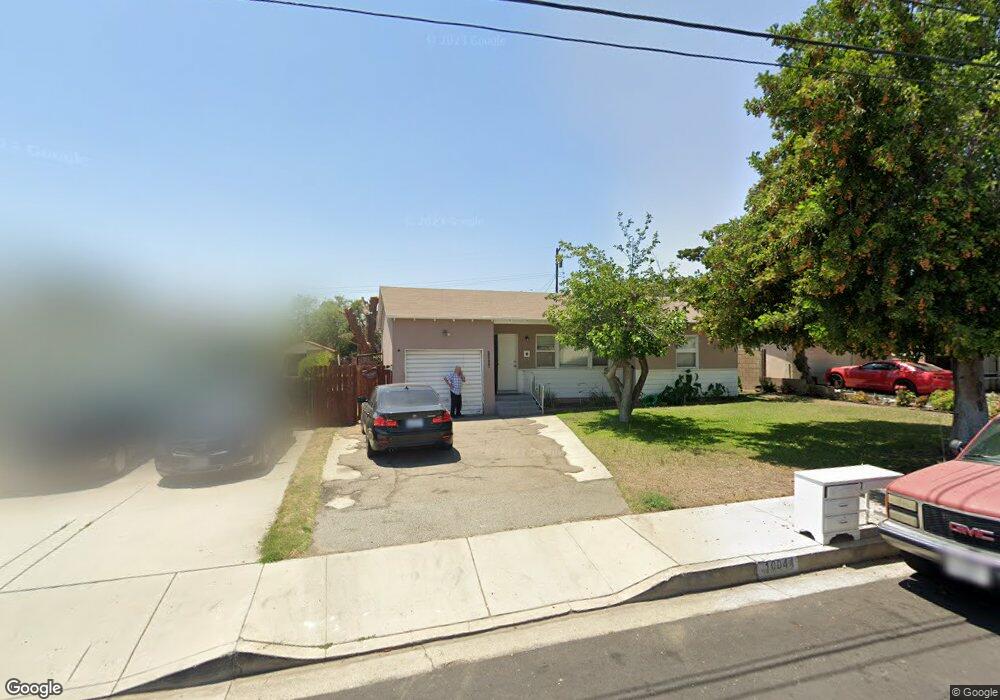
10044 Benson Ave Montclair, CA 91763
Estimated Value: $556,649 - $630,000
2
Beds
1
Bath
845
Sq Ft
$687/Sq Ft
Est. Value
About This Home
This home is located at 10044 Benson Ave, Montclair, CA 91763 and is currently estimated at $580,162, approximately $686 per square foot. 10044 Benson Ave is a home located in San Bernardino County with nearby schools including Elderberry Elementary, Vernon Middle School, and Montclair High School.
Ownership History
Date
Name
Owned For
Owner Type
Purchase Details
Closed on
Aug 16, 2011
Sold by
Monte Vista Assets Inc
Bought by
Malvarez Espinola Luis E and Malvarez Espinola Maria Victoria
Current Estimated Value
Home Financials for this Owner
Home Financials are based on the most recent Mortgage that was taken out on this home.
Original Mortgage
$127,500
Outstanding Balance
$86,279
Interest Rate
4.09%
Mortgage Type
New Conventional
Estimated Equity
$493,883
Purchase Details
Closed on
Dec 28, 2010
Sold by
Swift Shere Dee and The Shere Dee Swift Living Tru
Bought by
Monte Vista Assets Inc
Home Financials for this Owner
Home Financials are based on the most recent Mortgage that was taken out on this home.
Original Mortgage
$112,000
Interest Rate
4.82%
Mortgage Type
Purchase Money Mortgage
Purchase Details
Closed on
Jan 24, 2001
Sold by
Gutierrez Emilia
Bought by
Chase Manhattan Mtg Corp
Purchase Details
Closed on
Jul 26, 1993
Sold by
Swift Sheryl Diane
Bought by
Swift Shere Dee and Shere Dee Swift Living Trust
Create a Home Valuation Report for This Property
The Home Valuation Report is an in-depth analysis detailing your home's value as well as a comparison with similar homes in the area
Home Values in the Area
Average Home Value in this Area
Purchase History
| Date | Buyer | Sale Price | Title Company |
|---|---|---|---|
| Malvarez Espinola Luis E | $170,000 | Nations Title Company | |
| Monte Vista Assets Inc | $115,000 | Nations Title Company | |
| Chase Manhattan Mtg Corp | $132,926 | First American Title Ins Co | |
| Swift Shere Dee | -- | -- |
Source: Public Records
Mortgage History
| Date | Status | Borrower | Loan Amount |
|---|---|---|---|
| Open | Malvarez Espinola Luis E | $127,500 | |
| Previous Owner | Monte Vista Assets Inc | $112,000 |
Source: Public Records
Tax History
| Year | Tax Paid | Tax Assessment Tax Assessment Total Assessment is a certain percentage of the fair market value that is determined by local assessors to be the total taxable value of land and additions on the property. | Land | Improvement |
|---|---|---|---|---|
| 2025 | $2,361 | $213,532 | $74,737 | $138,795 |
| 2024 | $2,308 | $209,346 | $73,272 | $136,074 |
| 2023 | $2,243 | $205,241 | $71,835 | $133,406 |
| 2022 | $2,213 | $201,216 | $70,426 | $130,790 |
| 2021 | $2,199 | $197,270 | $69,045 | $128,225 |
| 2020 | $2,161 | $195,247 | $68,337 | $126,910 |
| 2019 | $2,142 | $191,419 | $66,997 | $124,422 |
| 2018 | $2,113 | $187,665 | $65,683 | $121,982 |
| 2017 | $2,037 | $183,985 | $64,395 | $119,590 |
| 2016 | $1,957 | $180,377 | $63,132 | $117,245 |
| 2015 | $1,944 | $177,668 | $62,184 | $115,484 |
| 2014 | $1,884 | $174,188 | $60,966 | $113,222 |
Source: Public Records
Map
Nearby Homes
- 5689 Orchard St
- 853 N Jasmine Ave
- 1540 W D St
- 5394 Evart St
- 1310 Hollowell St
- 5356 Alamitos St
- 516 N Begonia Ave
- 1228 W Rosewood Ct
- 1340 W Holt Blvd
- 1212 W Vesta St
- 1353 W Princeton St
- 1210 W Rosewood Ct
- 1307 W North Pinecrest Paseo
- 1309 W North Pinecrest Paseo
- 1330 W Oakcrest Paseo
- 1337 W 5th St
- 10037 Geneva Ave
- 5141 Aspen Dr
- 1342 N Benson Ave
- 10008 Geneva Ave
- 10034 Benson Ave
- 10052 Benson Ave
- 10032 Benson Ave
- 10062 Benson Ave
- 10051 Del Mar Ave
- 10045 Del Mar Ave
- 10061 Del Mar Ave
- 10033 Del Mar Ave
- 10071 Del Mar Ave
- 10016 Benson Ave
- 10072 Benson Ave
- 10021 Del Mar Ave
- 10081 Del Mar Ave
- 10004 Benson Ave
- 10009 Del Mar Ave
- 5690 Orchard St
- 5678 Orchard St
- 5670 Orchard St
- 10054 Del Mar Ave
- 9998 Benson Ave
Your Personal Tour Guide
Ask me questions while you tour the home.