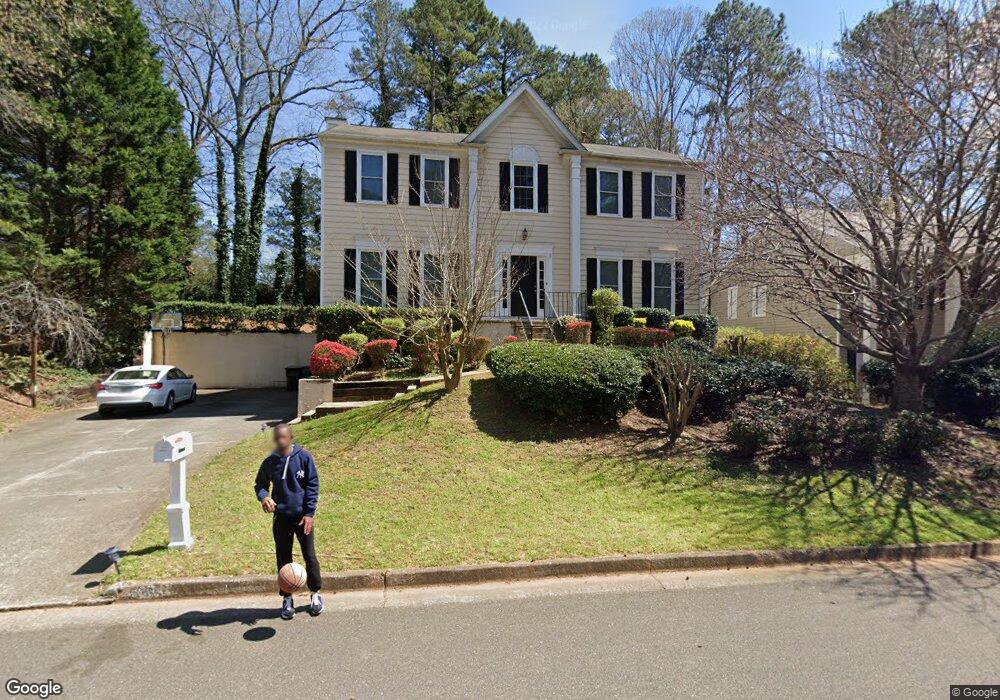
10045 Feather Sound Ct Alpharetta, GA 30022
Newtown NeighborhoodEstimated Value: $540,000 - $564,000
4
Beds
3
Baths
2,456
Sq Ft
$225/Sq Ft
Est. Value
About This Home
This home is located at 10045 Feather Sound Ct, Alpharetta, GA 30022 and is currently estimated at $553,285, approximately $225 per square foot. 10045 Feather Sound Ct is a home located in Fulton County with nearby schools including Barnwell Elementary School, Haynes Bridge Middle School, and Centennial High School.
Ownership History
Date
Name
Owned For
Owner Type
Purchase Details
Closed on
Aug 14, 2006
Sold by
Bush Ernest A
Bought by
Bradley Inez E
Current Estimated Value
Home Financials for this Owner
Home Financials are based on the most recent Mortgage that was taken out on this home.
Original Mortgage
$235,000
Interest Rate
6.67%
Mortgage Type
Trade
Purchase Details
Closed on
Jul 11, 2006
Sold by
Coldren James C and Coldren Donna S
Bought by
Bush Ernest A
Home Financials for this Owner
Home Financials are based on the most recent Mortgage that was taken out on this home.
Original Mortgage
$235,000
Interest Rate
6.67%
Mortgage Type
Trade
Purchase Details
Closed on
Jun 6, 1995
Sold by
George Paula M Robert W
Bought by
Coldren Donna S James C
Create a Home Valuation Report for This Property
The Home Valuation Report is an in-depth analysis detailing your home's value as well as a comparison with similar homes in the area
Home Values in the Area
Average Home Value in this Area
Purchase History
| Date | Buyer | Sale Price | Title Company |
|---|---|---|---|
| Bradley Inez E | $255,000 | -- | |
| Bush Ernest A | $219,200 | -- | |
| Coldren Donna S James C | $141,500 | -- |
Source: Public Records
Mortgage History
| Date | Status | Borrower | Loan Amount |
|---|---|---|---|
| Closed | Bradley Inez E | $235,000 | |
| Closed | Coldren Donna S James C | $0 |
Source: Public Records
Tax History Compared to Growth
Tax History
| Year | Tax Paid | Tax Assessment Tax Assessment Total Assessment is a certain percentage of the fair market value that is determined by local assessors to be the total taxable value of land and additions on the property. | Land | Improvement |
|---|---|---|---|---|
| 2025 | $845 | $180,440 | $49,840 | $130,600 |
| 2023 | $4,177 | $148,000 | $32,120 | $115,880 |
| 2022 | $951 | $152,080 | $32,120 | $119,960 |
| 2021 | $932 | $135,480 | $27,560 | $107,920 |
| 2020 | $934 | $126,000 | $24,640 | $101,360 |
| 2019 | $165 | $126,000 | $24,640 | $101,360 |
| 2018 | $760 | $130,120 | $24,640 | $105,480 |
| 2017 | $793 | $69,520 | $11,680 | $57,840 |
| 2016 | $760 | $69,520 | $11,680 | $57,840 |
| 2015 | $769 | $69,520 | $11,680 | $57,840 |
| 2014 | $811 | $69,520 | $11,680 | $57,840 |
Source: Public Records
Map
Nearby Homes
- 10085 Old Woodland Entry
- 130 Forrest View Terrace
- 300 Olmstead Way
- 201 Downing Dr Unit 76
- 615 S Preston Ct
- 305 Birch Rill Dr
- 385 Birch Rill Dr
- 10000 Barston Ct
- 3077 Haynes Trail
- 595 Oak Alley Way
- 320 Outwood Mill Ct
- 710 Leeds Garden Terrace
- 9715 Almaviva Dr
- 10421 Park Walk Point
- 9675 Almaviva Dr
- 440 Guildhall Grove Unit 2
- 10090 Jones Bridge Rd Unit 8
- 140 Old Sandhurst Landing
- 10055 Feather Sound Ct
- 10055 Feather Sound Ct Unit 13
- 10035 Feather Sound Ct
- 120 Randomwood Way
- 10040 Feather Sound Ct
- 10025 Feather Sound Ct
- 10050 Feather Sound Ct
- 10065 Feather Sound Ct
- 10030 Feather Sound Ct
- 10004 Inisfree Dr
- 10060 Feather Sound Ct
- 10004 Innisfree Dr
- 10020 Feather Sound Ct
- 10015 Feather Sound Ct
- 130 Randomwood Way
- 9994 Innisfree Dr
- 10070 Feather Sound Ct
- 10014 Inisfree Dr
- 10014 Innisfree Dr
- 0 Feather Sound Ct Unit 8728461