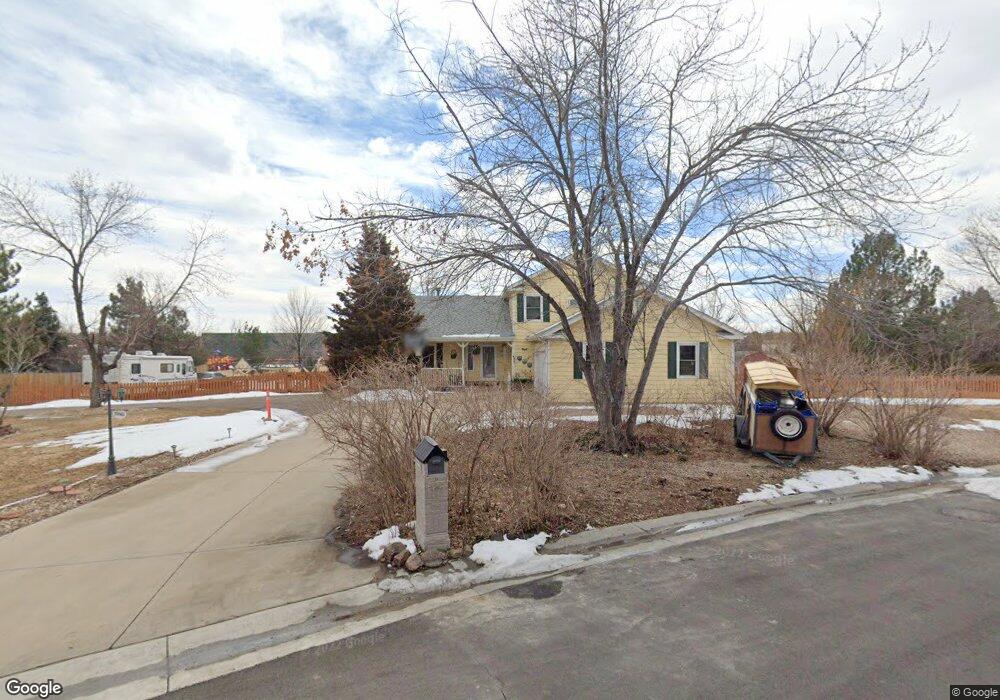
10046 Allison Ct Westminster, CO 80021
Church Ranch NeighborhoodEstimated Value: $851,000 - $1,041,000
4
Beds
3
Baths
2,492
Sq Ft
$373/Sq Ft
Est. Value
About This Home
This home is located at 10046 Allison Ct, Westminster, CO 80021 and is currently estimated at $928,834, approximately $372 per square foot. 10046 Allison Ct is a home located in Jefferson County with nearby schools including Semper Elementary School, Mandalay Middle School, and Standley Lake High School.
Ownership History
Date
Name
Owned For
Owner Type
Purchase Details
Closed on
Jul 29, 2022
Sold by
M And N Enterprises Ltd
Bought by
Philip-Neri Nicholas and Philip-Neri Mallika
Current Estimated Value
Home Financials for this Owner
Home Financials are based on the most recent Mortgage that was taken out on this home.
Original Mortgage
$450,000
Outstanding Balance
$430,864
Interest Rate
5.7%
Mortgage Type
New Conventional
Estimated Equity
$497,970
Purchase Details
Closed on
Feb 18, 2015
Sold by
Nicholas Philip Neri and Mallika Philip Neri
Bought by
M & N Enterprises Ltd
Purchase Details
Closed on
Apr 7, 2004
Sold by
Mahanti Dev
Bought by
Philip Neri Nicholas and Philip Neri Mallika
Home Financials for this Owner
Home Financials are based on the most recent Mortgage that was taken out on this home.
Original Mortgage
$290,000
Interest Rate
3.5%
Mortgage Type
Purchase Money Mortgage
Create a Home Valuation Report for This Property
The Home Valuation Report is an in-depth analysis detailing your home's value as well as a comparison with similar homes in the area
Home Values in the Area
Average Home Value in this Area
Purchase History
| Date | Buyer | Sale Price | Title Company |
|---|---|---|---|
| Philip-Neri Nicholas | -- | None Listed On Document | |
| M & N Enterprises Ltd | -- | None Available | |
| Philip Neri Nicholas | $362,500 | Guardian Title Agency Llc |
Source: Public Records
Mortgage History
| Date | Status | Borrower | Loan Amount |
|---|---|---|---|
| Open | Philip-Neri Nicholas | $450,000 | |
| Previous Owner | Philip Neri Nicholas | $290,000 | |
| Closed | Philip Neri Nicholas | $54,375 |
Source: Public Records
Tax History Compared to Growth
Tax History
| Year | Tax Paid | Tax Assessment Tax Assessment Total Assessment is a certain percentage of the fair market value that is determined by local assessors to be the total taxable value of land and additions on the property. | Land | Improvement |
|---|---|---|---|---|
| 2024 | $4,285 | $52,225 | $22,972 | $29,253 |
| 2023 | $4,285 | $52,225 | $22,972 | $29,253 |
| 2022 | $3,294 | $41,197 | $14,086 | $27,111 |
| 2021 | $3,338 | $42,383 | $14,492 | $27,891 |
| 2020 | $3,117 | $40,057 | $14,216 | $25,841 |
| 2019 | $3,066 | $40,057 | $14,216 | $25,841 |
| 2018 | $2,545 | $33,621 | $10,911 | $22,710 |
| 2017 | $2,326 | $33,621 | $10,911 | $22,710 |
| 2016 | $2,385 | $33,377 | $11,129 | $22,248 |
| 2015 | $2,906 | $33,377 | $11,129 | $22,248 |
| 2014 | $2,906 | $29,001 | $9,905 | $19,096 |
Source: Public Records
Map
Nearby Homes
- 9863 Zephyr Dr
- 10245 Wadsworth Blvd
- 10690 Dover St
- 9567 Brentwood Way Unit A
- 9663 Brentwood Way Unit B
- 9495 Webster Way
- 8200 W 106th Approx Ave
- 10121 Flower St
- 9703 Independence Dr Unit 9703
- 9008 W 101st Ave
- 6794 W 98th Cir
- 9263 W 98th Way
- 9068 W 101st Ave
- 10074 Flower St
- 9677 Independence Dr Unit 9677
- 9409 Brentwood St
- 9705 Carr Cir
- 9702 Carr Cir
- 9805 Garrison Ct
- 10416 Garland Ln
- 10025 Allison St
- 10047 Allison Ct
- 10036 Allison Ct
- 10024 Allison St
- 10055 Allison St
- 10026 Allison Ct
- 10054 Allison St
- 10015 Allison St
- 10014 Allison St
- 10085 Allison St
- 9941 Ammons Cir
- 8050 W 101st Ave
- 10084 Allison St
- 7900 W 101st Ave
- 10040 Yarrow St
- 9940 Ammons Cir
- 8090 W 101st Ave
- 8001 W 101st Ave
- 8047 W 101st Ave
- 7915 W 101st Ave