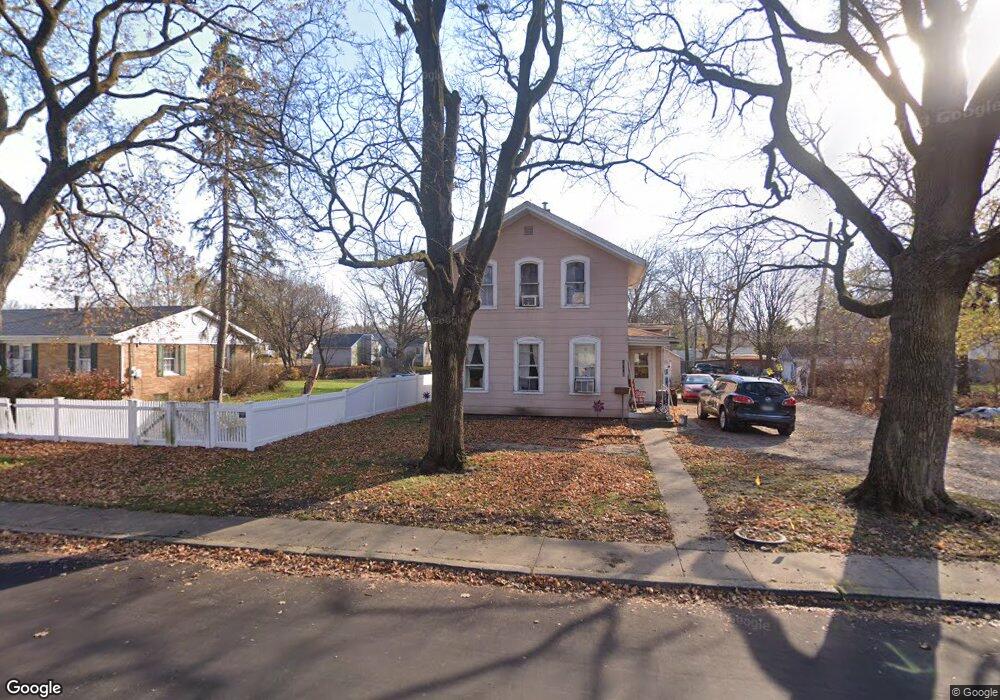
1005 4th St Mendota, IL 61342
Estimated Value: $94,000 - $156,000
Studio
--
Bath
2,016
Sq Ft
$57/Sq Ft
Est. Value
About This Home
This home is located at 1005 4th St, Mendota, IL 61342 and is currently estimated at $115,504, approximately $57 per square foot. 1005 4th St is a home located in LaSalle County with nearby schools including Northbrook School, Blackstone Elementary School, and Lincoln Elementary School.
Ownership History
Date
Name
Owned For
Owner Type
Purchase Details
Closed on
Mar 2, 2023
Sold by
Mcconville Joseph J
Bought by
Sondgeroth Holdings Llc
Current Estimated Value
Home Financials for this Owner
Home Financials are based on the most recent Mortgage that was taken out on this home.
Original Mortgage
$48,372
Outstanding Balance
$46,859
Interest Rate
6.15%
Mortgage Type
Commercial
Estimated Equity
$68,645
Purchase Details
Closed on
Feb 4, 2016
Sold by
Mcconville Emily
Bought by
Mcconville Joseph
Create a Home Valuation Report for This Property
The Home Valuation Report is an in-depth analysis detailing your home's value as well as a comparison with similar homes in the area
Home Values in the Area
Average Home Value in this Area
Purchase History
| Date | Buyer | Sale Price | Title Company |
|---|---|---|---|
| Sondgeroth Holdings Llc | $57,000 | None Available | |
| Mcconville Joseph | -- | -- |
Source: Public Records
Mortgage History
| Date | Status | Borrower | Loan Amount |
|---|---|---|---|
| Open | Sondgeroth Holdings Llc | $48,372 |
Source: Public Records
Tax History
| Year | Tax Paid | Tax Assessment Tax Assessment Total Assessment is a certain percentage of the fair market value that is determined by local assessors to be the total taxable value of land and additions on the property. | Land | Improvement |
|---|---|---|---|---|
| 2024 | $2,066 | $23,846 | $4,462 | $19,384 |
| 2023 | $1,979 | $22,207 | $4,155 | $18,052 |
| 2022 | $1,831 | $20,245 | $3,788 | $16,457 |
| 2021 | $1,823 | $19,164 | $3,586 | $15,578 |
| 2020 | $1,715 | $18,095 | $3,386 | $14,709 |
| 2019 | $1,739 | $18,095 | $3,386 | $14,709 |
| 2018 | $1,745 | $17,699 | $3,312 | $14,387 |
| 2017 | $1,768 | $17,475 | $3,270 | $14,205 |
| 2016 | $1,708 | $16,731 | $3,131 | $13,600 |
| 2015 | $1,664 | $16,223 | $3,036 | $13,187 |
| 2012 | -- | $18,581 | $3,478 | $15,103 |
Source: Public Records
Map
Nearby Homes
Your Personal Tour Guide
Ask me questions while you tour the home.