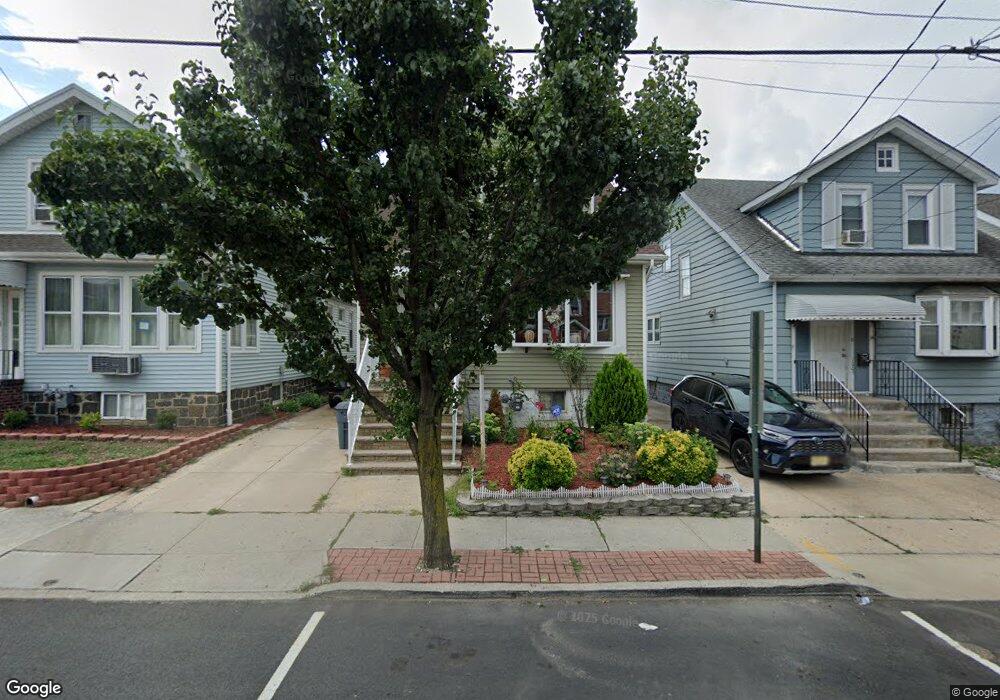
1005 88th St North Bergen, NJ 07047
Estimated Value: $644,465 - $763,000
--
Bed
--
Bath
1,451
Sq Ft
$483/Sq Ft
Est. Value
About This Home
This home is located at 1005 88th St, North Bergen, NJ 07047 and is currently estimated at $701,366, approximately $483 per square foot. 1005 88th St is a home located in Hudson County with nearby schools including North Bergen High School and Our Lady of Grace School.
Ownership History
Date
Name
Owned For
Owner Type
Purchase Details
Closed on
Aug 3, 2020
Sold by
Cordero Florina
Bought by
Cordero Florina and Cordero Alex M
Current Estimated Value
Home Financials for this Owner
Home Financials are based on the most recent Mortgage that was taken out on this home.
Original Mortgage
$144,195
Interest Rate
2.9%
Mortgage Type
New Conventional
Purchase Details
Closed on
Sep 27, 2002
Sold by
Colon Johnny and Corces Colon Miriam
Bought by
Cordero Pedro R and Cordero Florina
Home Financials for this Owner
Home Financials are based on the most recent Mortgage that was taken out on this home.
Original Mortgage
$218,000
Interest Rate
6.27%
Purchase Details
Closed on
Aug 31, 2000
Sold by
Corces Raimundo and Corces Ana M
Bought by
Colon John and Corces Colon Miriam
Home Financials for this Owner
Home Financials are based on the most recent Mortgage that was taken out on this home.
Original Mortgage
$150,000
Interest Rate
8.07%
Create a Home Valuation Report for This Property
The Home Valuation Report is an in-depth analysis detailing your home's value as well as a comparison with similar homes in the area
Home Values in the Area
Average Home Value in this Area
Purchase History
| Date | Buyer | Sale Price | Title Company |
|---|---|---|---|
| Cordero Florina | -- | Chicago Title | |
| Cordero Florina | -- | All Ahead Title | |
| Cordero Pedro R | $292,000 | Ticor Title Insurance Compan | |
| Colon John | $200,000 | -- |
Source: Public Records
Mortgage History
| Date | Status | Borrower | Loan Amount |
|---|---|---|---|
| Previous Owner | Cordero Florina | $144,195 | |
| Previous Owner | Cordero Pedro R | $218,000 | |
| Previous Owner | Colon John | $150,000 |
Source: Public Records
Tax History Compared to Growth
Tax History
| Year | Tax Paid | Tax Assessment Tax Assessment Total Assessment is a certain percentage of the fair market value that is determined by local assessors to be the total taxable value of land and additions on the property. | Land | Improvement |
|---|---|---|---|---|
| 2025 | $9,158 | $524,200 | $326,000 | $198,200 |
| 2024 | $8,534 | $524,200 | $326,000 | $198,200 |
| 2023 | $8,534 | $524,200 | $326,000 | $198,200 |
| 2022 | $8,277 | $524,200 | $326,000 | $198,200 |
| 2021 | $8,979 | $153,400 | $75,600 | $77,800 |
| 2020 | $8,793 | $153,400 | $75,600 | $77,800 |
| 2019 | $8,784 | $153,400 | $75,600 | $77,800 |
| 2018 | $8,646 | $153,400 | $75,600 | $77,800 |
| 2017 | $8,485 | $153,400 | $75,600 | $77,800 |
| 2016 | $8,386 | $153,400 | $75,600 | $77,800 |
| 2015 | $8,116 | $153,400 | $75,600 | $77,800 |
| 2014 | $8,038 | $153,400 | $75,600 | $77,800 |
Source: Public Records
Map
Nearby Homes
- 8829 Kennedy Blvd Unit D1
- 8802 5th Ave
- 8804 5th Ave
- 8915 Bergenwood Ave Unit 20
- 8915 Bergenwood Ave Unit 14
- 9015 Bergenwood Ave Unit 4
- 1204 86th St
- 9017 Bergenwood Ave Unit 10
- 8515 5th Ave
- 9005 Durham Ave
- 8610 Columbia Ave
- 8423 Newkirk Ave
- 1502 85th St
- 1100 83rd St Unit C1
- 8701 Bergenline Ave Unit A1
- 8811 Bergenline Ave Unit 25
- 8811 Bergenline Ave Unit 51
- 8408 Grand Ave
- 9252 Kennedy Blvd Unit 201
- 426 Hancock Place
- 1001 88th St
- 911 88th St
- 1009 88th St
- 914 87th St
- 914 87th St Unit 1
- 907 88th St
- 1011 88th St
- 912 87th St
- 908 87th St
- 908 87th St Unit 2
- 908 87th St Unit 1
- 905 88th St
- 1015 88th St
- 1000 87th St
- 906 87th St
- 906 87th St Unit 2
- 906 87th St Unit 2nd floor
- 906 87th St Unit 1st floor
- 1004 88th St
- 1000 88th St