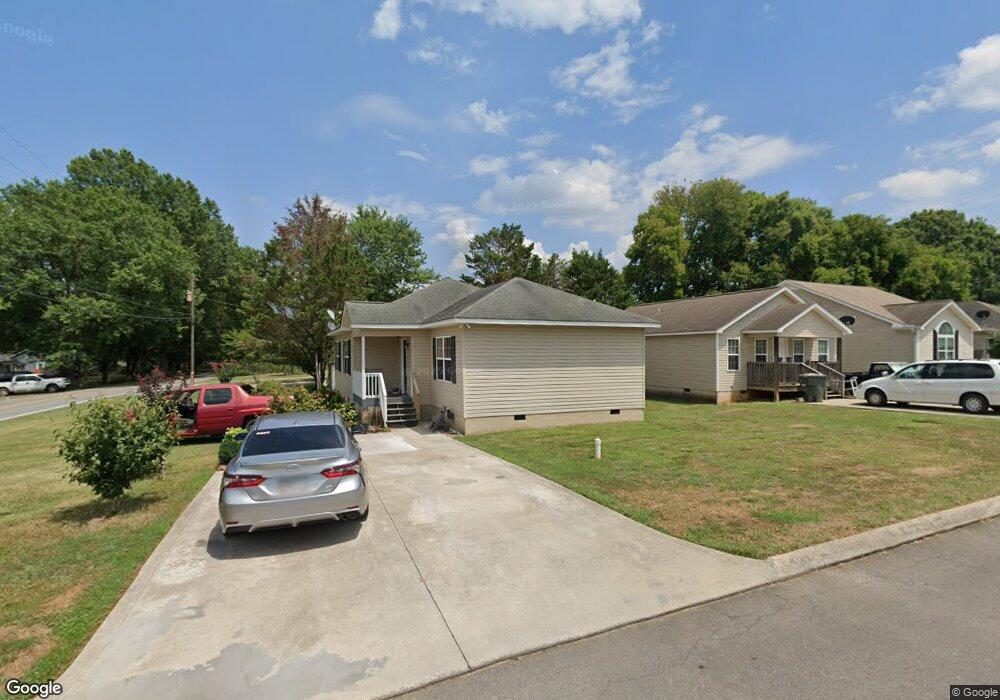
1005 Alyssa Ct Dalton, GA 30720
Estimated Value: $195,000 - $304,000
3
Beds
2
Baths
3,500
Sq Ft
$66/Sq Ft
Est. Value
About This Home
This home is located at 1005 Alyssa Ct, Dalton, GA 30720 and is currently estimated at $229,576, approximately $65 per square foot. 1005 Alyssa Ct is a home located in Whitfield County with nearby schools including Dug Gap Elementary School, Valley Point Middle School, and Southeast Whitfield County High School.
Ownership History
Date
Name
Owned For
Owner Type
Purchase Details
Closed on
Dec 28, 2018
Sold by
Mendiola Segura Rafael
Bought by
Perez Reyes Ismael
Current Estimated Value
Purchase Details
Closed on
Jun 23, 2008
Sold by
Not Provided
Bought by
Segura Rafael Mendiola and Mendiola Maria
Home Financials for this Owner
Home Financials are based on the most recent Mortgage that was taken out on this home.
Original Mortgage
$115,983
Interest Rate
5.96%
Mortgage Type
FHA
Purchase Details
Closed on
Jan 7, 2008
Sold by
Not Provided
Bought by
Segura Rafael Mendiola and Mendiola Maria
Create a Home Valuation Report for This Property
The Home Valuation Report is an in-depth analysis detailing your home's value as well as a comparison with similar homes in the area
Home Values in the Area
Average Home Value in this Area
Purchase History
| Date | Buyer | Sale Price | Title Company |
|---|---|---|---|
| Perez Reyes Ismael | -- | -- | |
| Segura Rafael Mendiola | $116,000 | -- | |
| Segura Rafael Mendiola | $29,500 | -- |
Source: Public Records
Mortgage History
| Date | Status | Borrower | Loan Amount |
|---|---|---|---|
| Previous Owner | Segura Rafael Mendiola | $115,983 |
Source: Public Records
Tax History Compared to Growth
Tax History
| Year | Tax Paid | Tax Assessment Tax Assessment Total Assessment is a certain percentage of the fair market value that is determined by local assessors to be the total taxable value of land and additions on the property. | Land | Improvement |
|---|---|---|---|---|
| 2024 | $1,401 | $74,523 | $9,000 | $65,523 |
| 2023 | $1,401 | $53,740 | $12,400 | $41,340 |
| 2022 | $885 | $38,543 | $8,000 | $30,543 |
| 2021 | $885 | $38,543 | $8,000 | $30,543 |
| 2020 | $903 | $38,543 | $8,000 | $30,543 |
| 2019 | $945 | $39,596 | $8,000 | $31,596 |
| 2018 | $955 | $39,596 | $8,000 | $31,596 |
| 2017 | $955 | $39,596 | $8,000 | $31,596 |
| 2016 | $984 | $41,337 | $12,600 | $28,737 |
| 2014 | $914 | $41,337 | $12,600 | $28,737 |
| 2013 | -- | $41,337 | $12,600 | $28,737 |
Source: Public Records
Map
Nearby Homes
- 439 Florence Ave
- 408 Alex Dr
- 1731 Ball Ave
- 1815 City View St
- 3016 E Brookhaven Cir
- 115& 134 Independence Way
- 1632 Rio Vista Dr
- 1922 W Brookhaven Cir
- 1915 W Brookhaven Cir
- 0 Vinewood Dr
- 1922 W Brookhaven Cir
- 1504 Belmont Dr
- 0 Horizon Ct Unit 130497
- 0 Horizon Ct Unit 130499
- 0 Horizon Ct Unit 130479
- 0 Horizon Ct Unit 130477
- 0 Horizon Ct Unit 130478
- 0 Horizon Ct Unit 130496
- 0 Horizon Ct Unit 130498
- 0 Taylor Dr Unit 130142
- 1015 Alyssa Ct
- 1015 Alyssa Ct Unit 4
- 223 Foster Rd
- 0 Alyssa Ct Unit 1160148
- 0 Alyssa Ct Unit 1160147
- 1000 Alyssa Ct
- 1035 Alyssa Ct
- 1020 Alyssa Ct
- 1045 Alyssa Ct
- 227 Foster Rd
- 1055 Alyssa Ct
- 1055 Alyssa Ct Unit 8
- 220 Foster Rd
- 1030 Alyssa Ct
- 0 Foster Rd Unit 1363523
- 0 Foster Rd Unit RTC2739913
- 0 Foster Rd Unit RTC2445928
- 0 Foster Rd
- 1040 Alyssa Ct
- 1065 Alyssa Ct