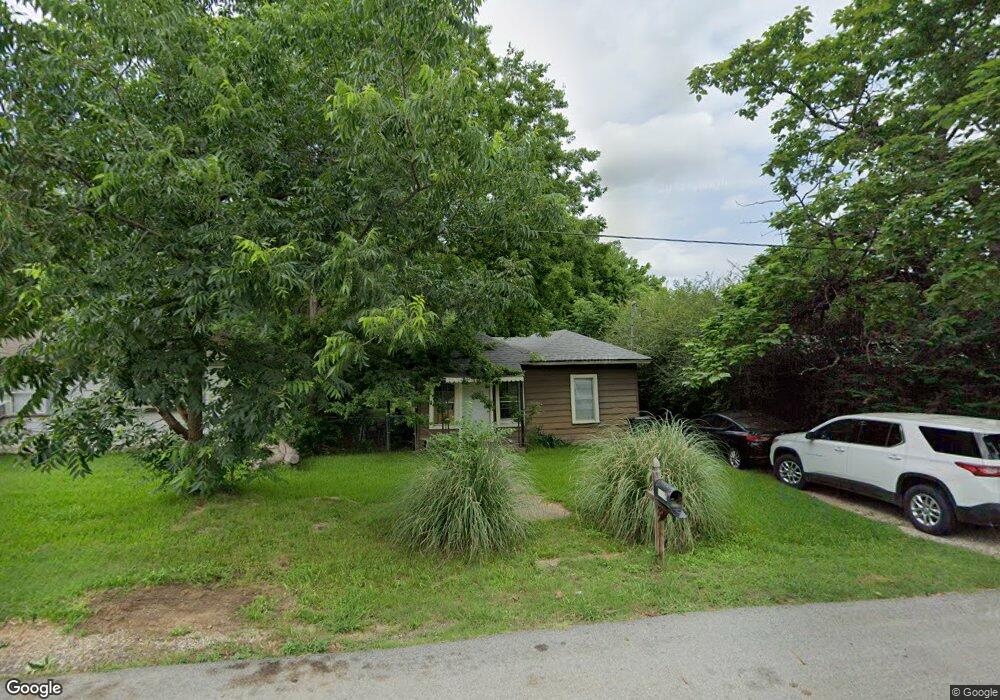
1005 Baker St Denison, TX 75020
Estimated Value: $122,089 - $158,000
--
Bed
--
Bath
729
Sq Ft
$192/Sq Ft
Est. Value
About This Home
This home is located at 1005 Baker St, Denison, TX 75020 and is currently estimated at $140,045, approximately $192 per square foot. 1005 Baker St is a home located in Grayson County with nearby schools including Scott Middle School, Denison High School, and St. Luke's Parish Day School.
Ownership History
Date
Name
Owned For
Owner Type
Purchase Details
Closed on
Jul 11, 2023
Sold by
Simple Abundant Life Together Inc
Bought by
Garcia Jamie
Current Estimated Value
Home Financials for this Owner
Home Financials are based on the most recent Mortgage that was taken out on this home.
Original Mortgage
$70,000
Outstanding Balance
$68,299
Interest Rate
6.69%
Mortgage Type
New Conventional
Estimated Equity
$71,746
Purchase Details
Closed on
Dec 22, 2009
Sold by
Boatner Marie
Bought by
Chris Vickrey Family Limited Partnership
Purchase Details
Closed on
Dec 18, 2009
Sold by
Boatner Donald and Cerra Michele Lynn
Bought by
Boatner Beatrice Marie
Purchase Details
Closed on
Dec 9, 2005
Sold by
Drury Rebekah A
Bought by
Boatner David and Boatner Marie
Home Financials for this Owner
Home Financials are based on the most recent Mortgage that was taken out on this home.
Original Mortgage
$15,759
Interest Rate
6.3%
Mortgage Type
Seller Take Back
Create a Home Valuation Report for This Property
The Home Valuation Report is an in-depth analysis detailing your home's value as well as a comparison with similar homes in the area
Home Values in the Area
Average Home Value in this Area
Purchase History
| Date | Buyer | Sale Price | Title Company |
|---|---|---|---|
| Garcia Jamie | -- | None Listed On Document | |
| Chris Vickrey Family Limited Partnership | -- | Red River Title Co | |
| Boatner Beatrice Marie | -- | Red River Title Co | |
| Boatner David | -- | None Available |
Source: Public Records
Mortgage History
| Date | Status | Borrower | Loan Amount |
|---|---|---|---|
| Open | Garcia Jamie | $70,000 | |
| Previous Owner | Boatner David | $15,759 |
Source: Public Records
Tax History Compared to Growth
Tax History
| Year | Tax Paid | Tax Assessment Tax Assessment Total Assessment is a certain percentage of the fair market value that is determined by local assessors to be the total taxable value of land and additions on the property. | Land | Improvement |
|---|---|---|---|---|
| 2025 | $1,578 | $70,175 | $40,016 | $30,159 |
| 2024 | $1,578 | $67,916 | $36,670 | $31,246 |
| 2023 | $693 | $64,557 | $35,293 | $29,264 |
| 2022 | $1,500 | $63,153 | $35,293 | $27,860 |
| 2021 | $911 | $36,129 | $13,120 | $23,009 |
| 2020 | $902 | $34,200 | $9,840 | $24,360 |
| 2019 | $956 | $34,754 | $9,840 | $24,914 |
| 2018 | $957 | $34,506 | $5,904 | $28,602 |
| 2017 | $826 | $29,510 | $3,280 | $26,230 |
| 2016 | $737 | $26,352 | $3,280 | $23,072 |
| 2015 | $548 | $19,409 | $3,280 | $16,129 |
| 2014 | $548 | $19,409 | $3,280 | $16,129 |
Source: Public Records
Map
Nearby Homes
- 919 W Collins St
- 923 W Collins St
- 921 W Collins St
- 916 W Collins St
- 923 Dubois St
- 603 W Star St
- 930 W Florence St
- 1901 Woodlawn Blvd
- 904 W Florence St
- 1130 Amsden Cir
- 938 Amsden St
- 905 Seymore Cir
- 903 Seymore Cir
- 711 Dubois St
- 701 W Star St
- 3101 S College Blvd
- 1044 W Ford St
- 928 W Chase St
- 527 W Coffin St
- 700 Dubois St
- 1001 Baker St
- 1009 Baker St
- 1013 Baker St
- 1008 W Collins St
- 2601 S College Blvd
- 1001 Rice St
- 1014 W Collins St
- 1000 Baker St
- 1008 Baker St
- 931 Baker St
- 1010 Baker St
- 1017 Baker St
- 1012 Baker St
- 2600 S College Blvd
- 1014 W Baker St
- 1014 Baker St
- 927 Baker St
- 927 W Baker St
- 1019 Baker St
- 1019 W Baker St