Estimated Value: $85,690 - $110,000
3
Beds
2
Baths
1,044
Sq Ft
$93/Sq Ft
Est. Value
About This Home
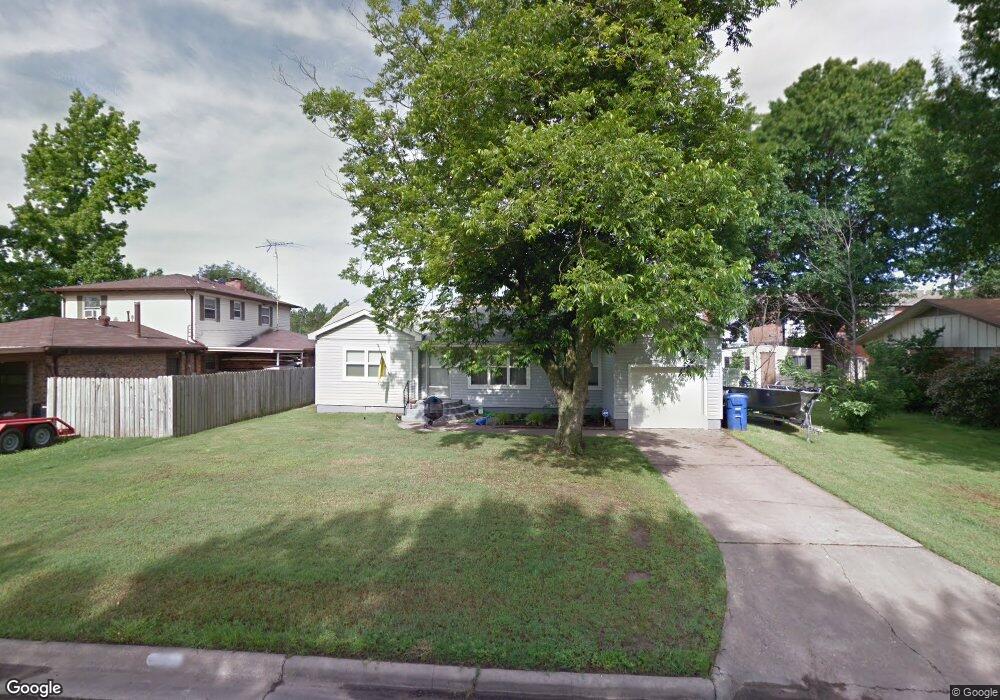
This home is located at 1005 Barger Place, Miami, OK 74354 and is currently estimated at $97,423, approximately $93 per square foot. 1005 Barger Place is a home located in Ottawa County with nearby schools including Miami High School and Mt. Olive Lutheran School.
Ownership History
Date
Name
Owned For
Owner Type
Purchase Details
Closed on
Dec 23, 2024
Sold by
Thompson Tiffani J and Harkins Tiffani J
Bought by
Harkins Tiffani J and Harkins Brandon
Current Estimated Value
Purchase Details
Closed on
May 1, 2017
Sold by
Calan Jaycee A and Calan Kace L
Bought by
Thompson Tiffani J
Home Financials for this Owner
Home Financials are based on the most recent Mortgage that was taken out on this home.
Original Mortgage
$48,227
Interest Rate
4.3%
Mortgage Type
New Conventional
Purchase Details
Closed on
Dec 28, 2009
Sold by
Oexman Charles D and Oexman Donna S
Bought by
Calan Jaycee A and Calan Kace L
Home Financials for this Owner
Home Financials are based on the most recent Mortgage that was taken out on this home.
Original Mortgage
$48,400
Interest Rate
4.8%
Mortgage Type
Future Advance Clause Open End Mortgage
Purchase Details
Closed on
Feb 7, 2003
Bought by
Oexman Charles and Oexman Donna
Purchase Details
Closed on
Mar 5, 1993
Bought by
Jones Willie and Jones Wanda
Create a Home Valuation Report for This Property
The Home Valuation Report is an in-depth analysis detailing your home's value as well as a comparison with similar homes in the area
Home Values in the Area
Average Home Value in this Area
Purchase History
| Date | Buyer | Sale Price | Title Company |
|---|---|---|---|
| Harkins Tiffani J | -- | None Listed On Document | |
| Thompson Tiffani J | $60,500 | Ottawa County Abstract & Tit | |
| Calan Jaycee A | -- | None Available | |
| Oexman Charles | $25,000 | -- | |
| Jones Willie | -- | -- |
Source: Public Records
Mortgage History
| Date | Status | Borrower | Loan Amount |
|---|---|---|---|
| Previous Owner | Thompson Tiffani J | $48,227 | |
| Previous Owner | Calan Jaycee A | $48,400 |
Source: Public Records
Tax History Compared to Growth
Tax History
| Year | Tax Paid | Tax Assessment Tax Assessment Total Assessment is a certain percentage of the fair market value that is determined by local assessors to be the total taxable value of land and additions on the property. | Land | Improvement |
|---|---|---|---|---|
| 2025 | $698 | $6,613 | $684 | $5,929 |
| 2024 | $698 | $7,242 | $684 | $6,558 |
| 2023 | $698 | $6,897 | $684 | $6,213 |
| 2022 | $638 | $6,897 | $684 | $6,213 |
| 2021 | $652 | $6,897 | $684 | $6,213 |
| 2020 | $657 | $6,897 | $684 | $6,213 |
| 2019 | $566 | $6,897 | $684 | $6,213 |
| 2018 | $566 | $6,853 | $684 | $6,169 |
| 2017 | $548 | $6,527 | $684 | $5,843 |
| 2016 | $538 | $6,697 | $684 | $6,013 |
| 2015 | $253 | $2,850 | $443 | $2,407 |
| 2014 | $565 | $6,897 | $855 | $6,042 |
Source: Public Records
Map
Nearby Homes
- 302 10th Ave NW
- 1013 Barger Place
- 1004 Barger Place
- 1010 Barger Place
- 210 10th Ave NW
- 1017 Barger Place
- 1014 Barger Place
- 221 10th Ave NW
- 1018 Barger Place
- 1015 B St NW
- 225 10th Ave NW
- 1001 B St NW
- 1100 Pine Place Unit 217
- 927 Pine St
- 931 Pine St
- 1031 Barger Place
- 925 Pine St
- 939 B St NW
- 1023 B St NW
- 1030 Barger Place