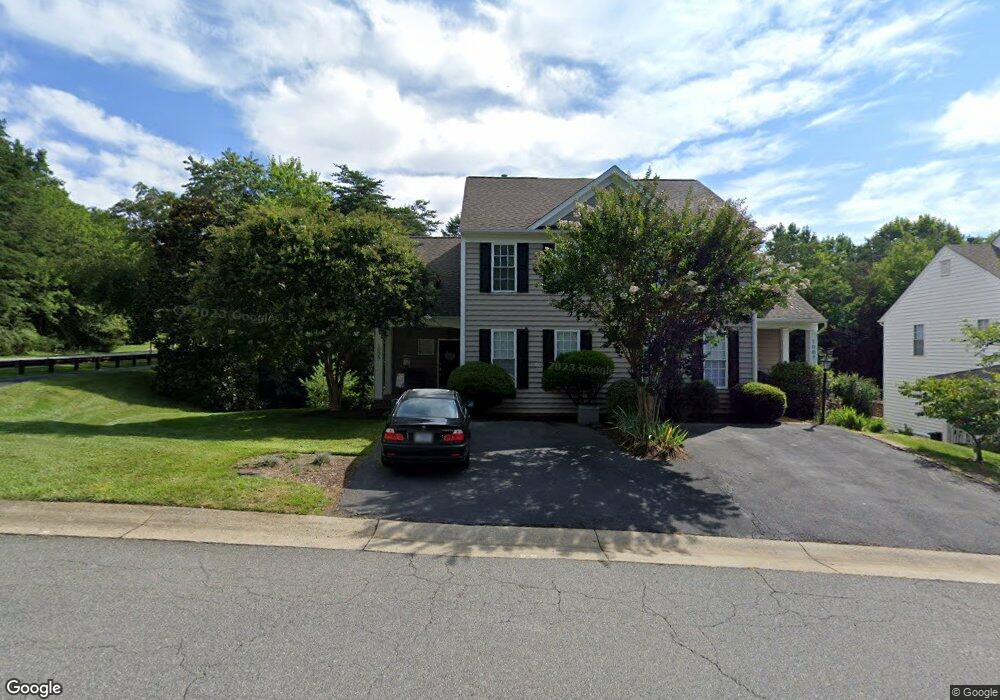
1005 Bristlecone Ln Charlottesville, VA 22911
Estimated Value: $417,000 - $477,000
3
Beds
3
Baths
1,810
Sq Ft
$245/Sq Ft
Est. Value
About This Home
This home is located at 1005 Bristlecone Ln, Charlottesville, VA 22911 and is currently estimated at $443,665, approximately $245 per square foot. 1005 Bristlecone Ln is a home located in Albemarle County with nearby schools including Hollymead Elementary School, Lakeside Middle School, and Albemarle High School.
Ownership History
Date
Name
Owned For
Owner Type
Purchase Details
Closed on
May 14, 2019
Sold by
Jones Bryan J and Jones Kathleen M
Bought by
Johnson Randal and Shipley Johnson Christine
Current Estimated Value
Home Financials for this Owner
Home Financials are based on the most recent Mortgage that was taken out on this home.
Original Mortgage
$313,396
Outstanding Balance
$274,979
Interest Rate
4.1%
Mortgage Type
VA
Estimated Equity
$168,686
Purchase Details
Closed on
Feb 16, 2016
Sold by
Hong Gregory K and Hong Terumi M
Bought by
Jones Kathleen M
Home Financials for this Owner
Home Financials are based on the most recent Mortgage that was taken out on this home.
Original Mortgage
$233,100
Interest Rate
3.97%
Mortgage Type
New Conventional
Create a Home Valuation Report for This Property
The Home Valuation Report is an in-depth analysis detailing your home's value as well as a comparison with similar homes in the area
Home Values in the Area
Average Home Value in this Area
Purchase History
| Date | Buyer | Sale Price | Title Company |
|---|---|---|---|
| Johnson Randal | $327,000 | Court Square Title | |
| Jones Kathleen M | $259,000 | -- |
Source: Public Records
Mortgage History
| Date | Status | Borrower | Loan Amount |
|---|---|---|---|
| Open | Johnson Randal | $313,396 | |
| Previous Owner | Jones Kathleen M | $233,100 | |
| Previous Owner | Hong Gregory K | $220,166 | |
| Previous Owner | Hong Gregory K | $228,000 | |
| Previous Owner | Eheart Margaret R | $50,000 | |
| Previous Owner | Bheart Margaret R | $200,000 |
Source: Public Records
Tax History Compared to Growth
Tax History
| Year | Tax Paid | Tax Assessment Tax Assessment Total Assessment is a certain percentage of the fair market value that is determined by local assessors to be the total taxable value of land and additions on the property. | Land | Improvement |
|---|---|---|---|---|
| 2025 | $3,734 | $417,700 | $96,900 | $320,800 |
| 2024 | -- | $402,700 | $93,000 | $309,700 |
| 2023 | $3,357 | $393,100 | $84,700 | $308,400 |
| 2022 | $3,074 | $359,900 | $84,700 | $275,200 |
| 2021 | $2,614 | $306,100 | $81,800 | $224,300 |
| 2020 | $2,634 | $308,400 | $78,300 | $230,100 |
| 2019 | $2,435 | $285,100 | $78,300 | $206,800 |
| 2018 | $2,299 | $290,700 | $78,300 | $212,400 |
| 2017 | $2,159 | $257,300 | $58,800 | $198,500 |
| 2016 | $2,163 | $257,800 | $53,900 | $203,900 |
| 2015 | $1,002 | $244,600 | $53,900 | $190,700 |
| 2014 | -- | $242,500 | $53,900 | $188,600 |
Source: Public Records
Map
Nearby Homes
- 1007 Bristlecone Ln
- 1013 Bristlecone Ln
- 1017 Bristlecone Ln
- 1019 Bristlecone Ln
- 2889 Chimney Springs
- 2895 Chimney Springs
- 2889 Chimney Springs
- 2895 Chimney Springs
- 1100 Rustic Willow Ln
- 1023 Bristlecone Ln
- 2840 Stratford Glen Way
- 2834 Stratford Glen Way
- 2890 Chimney Springs
- 2846 Stratford Glen Way
- 2890 Chimney Springs
- 2828 Stratford Glen Way
- 1106 Rustic Willow Ln
- 1029 Bristlecone Ln
- 2901 Chimney Springs
- 2822 Stratford Glen Way