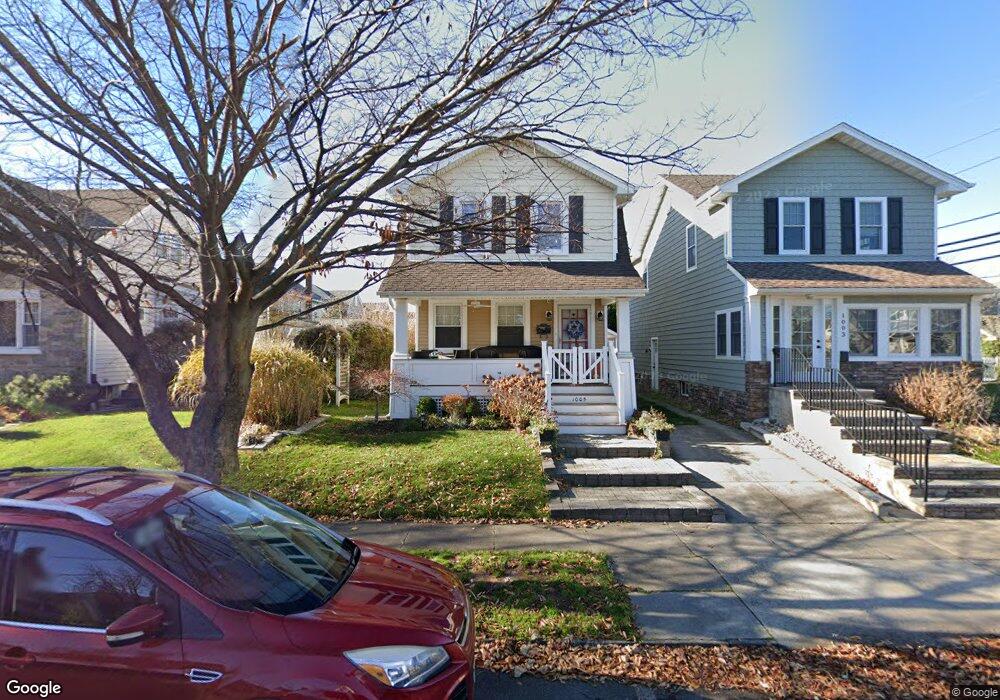
1005 C St Belmar, NJ 07719
Estimated Value: $801,000 - $1,289,000
4
Beds
2
Baths
1,492
Sq Ft
$675/Sq Ft
Est. Value
About This Home
This home is located at 1005 C St, Belmar, NJ 07719 and is currently estimated at $1,007,606, approximately $675 per square foot. 1005 C St is a home located in Monmouth County with nearby schools including Belmar Elementary School, St. Rose Grammar School, and St Rose High School.
Ownership History
Date
Name
Owned For
Owner Type
Purchase Details
Closed on
Oct 10, 2013
Sold by
Spizz Reyna M and Brandl Christopher
Bought by
Spizz Brandi Reyna M
Current Estimated Value
Home Financials for this Owner
Home Financials are based on the most recent Mortgage that was taken out on this home.
Original Mortgage
$190,000
Outstanding Balance
$141,990
Interest Rate
4.36%
Mortgage Type
New Conventional
Estimated Equity
$865,616
Purchase Details
Closed on
Mar 29, 2004
Sold by
Spizz Jason
Bought by
Spiz Reyna
Home Financials for this Owner
Home Financials are based on the most recent Mortgage that was taken out on this home.
Original Mortgage
$217,000
Interest Rate
5.36%
Purchase Details
Closed on
May 19, 1999
Sold by
Kaplan Mark
Bought by
Spizz Sheldon
Create a Home Valuation Report for This Property
The Home Valuation Report is an in-depth analysis detailing your home's value as well as a comparison with similar homes in the area
Home Values in the Area
Average Home Value in this Area
Purchase History
| Date | Buyer | Sale Price | Title Company |
|---|---|---|---|
| Spizz Brandi Reyna M | -- | Target Title Agency Inc | |
| Spiz Reyna | $170,000 | -- | |
| Spizz Sheldon | $146,000 | -- |
Source: Public Records
Mortgage History
| Date | Status | Borrower | Loan Amount |
|---|---|---|---|
| Open | Spizz Brandi Reyna M | $190,000 | |
| Closed | Spiz Reyna | $217,000 |
Source: Public Records
Tax History
| Year | Tax Paid | Tax Assessment Tax Assessment Total Assessment is a certain percentage of the fair market value that is determined by local assessors to be the total taxable value of land and additions on the property. | Land | Improvement |
|---|---|---|---|---|
| 2025 | $7,453 | $512,200 | $353,600 | $158,600 |
| 2024 | $7,202 | $512,200 | $353,600 | $158,600 |
| 2023 | $7,202 | $512,200 | $353,600 | $158,600 |
| 2022 | $6,951 | $512,200 | $353,600 | $158,600 |
| 2021 | $6,951 | $512,200 | $353,600 | $158,600 |
| 2020 | $6,889 | $512,200 | $353,600 | $158,600 |
| 2019 | $6,889 | $512,200 | $353,600 | $158,600 |
| 2018 | $6,326 | $512,200 | $353,600 | $158,600 |
| 2017 | $6,172 | $512,200 | $353,600 | $158,600 |
| 2016 | $5,234 | $273,900 | $147,000 | $126,900 |
| 2015 | $5,544 | $288,900 | $162,000 | $126,900 |
| 2014 | $5,203 | $268,900 | $142,000 | $126,900 |
Source: Public Records
Map
Nearby Homes
- 503 11th Ave
- 1203 D St
- 113 12th Ave
- 105 11th Ave
- 107 12th Ave
- 517 14th Ave
- 106 8th Ave
- 116 15th Ave
- 1304 Ocean Ave Unit 6A
- 1000 River Rd Unit 7G
- 204 19th Ave
- 520 18th Ave
- 107 18th Ave
- 823 13th Ave
- 201 2nd Ave Unit 4B
- 1200 H St
- 1812 Fernwood Rd Unit 2
- 1809 Fernwood Rd
- 241 Schooner Cir
- 371 Sea Spray Ct
Your Personal Tour Guide
Ask me questions while you tour the home.