
Seller's Agent in 2018
Mary Lyle
Top Hand Property Services
(816) 387-1930
18 in this area
40 Total Sales
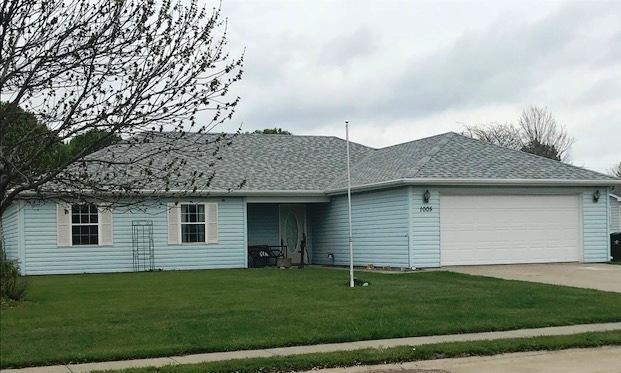
Estimated Value: $238,000 - $270,000
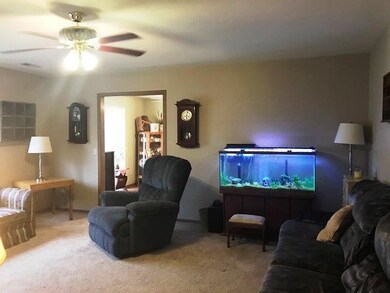
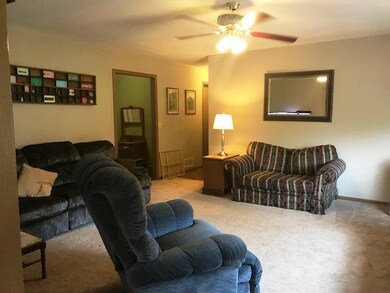
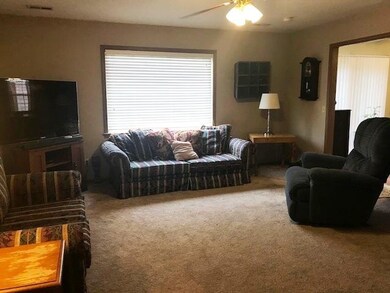
Seller will give $1000 carpet allowance or replace living room & master bedroom carpet after moving out (with acceptable offer)
Last Agent to Sell the Property
Top Hand Property Services License #1999094937 Listed on: 05/01/2018
| Date | Buyer | Sale Price | Title Company |
|---|---|---|---|
| Wheeler Amanda L | -- | -- | |
| Shoemaker Daniel L | -- | -- | |
| Criss Carol J | -- | -- |
| Date | Status | Borrower | Loan Amount |
|---|---|---|---|
| Open | Wheeler Amanda L | $151,414 | |
| Previous Owner | Shoemaker Daniel L | $140,409 |
| Date | Event | Price | List to Sale | Price per Sq Ft |
|---|---|---|---|---|
| 06/14/2018 06/14/18 | Sold | -- | -- | -- |
| 05/05/2018 05/05/18 | Pending | -- | -- | -- |
| 05/01/2018 05/01/18 | For Sale | $149,900 | -- | $97 / Sq Ft |
| Year | Tax Paid | Tax Assessment Tax Assessment Total Assessment is a certain percentage of the fair market value that is determined by local assessors to be the total taxable value of land and additions on the property. | Land | Improvement |
|---|---|---|---|---|
| 2025 | $1,556 | $25,310 | $4,020 | $21,290 |
| 2024 | $1,556 | $22,870 | $4,020 | $18,850 |
| 2023 | $1,484 | $22,870 | $4,020 | $18,850 |
| 2022 | $1,482 | $22,870 | $4,020 | $18,850 |
| 2021 | $1,430 | $22,870 | $4,020 | $18,850 |
| 2020 | $1,396 | $22,870 | $4,020 | $18,850 |
| 2019 | $1,421 | $22,870 | $4,020 | $18,850 |
| 2018 | $1,389 | $22,870 | $4,020 | $18,850 |
| 2017 | $0 | $22,870 | $4,020 | $18,850 |
| 2016 | $1,396 | $22,870 | $4,020 | $18,850 |
| 2015 | -- | $22,870 | $4,020 | $18,850 |
| 2011 | -- | $116,830 | $21,160 | $95,670 |
Seller's Agent in 2018
Mary Lyle
Top Hand Property Services
(816) 387-1930
18 in this area
40 Total Sales
Source: Heartland MLS
MLS Number: 117522
APN: 13-2.0-10-0-00-29.250000
Disclaimer: Certain information contained herein is derived from information provided by parties other than Homes.com. All information provided is deemed reliable, but is not guaranteed to be accurate and should be independently verified.
![]() Based on information submitted to the MLS Grid. All data is obtained from various sources and may not have been verified by broker or MLS GRID. Supplied Open House Information is subject to change without notice. All information should be independently reviewed and verified for accuracy. Properties may or may not be listed by the office/agent presenting the information. Some IDX listings have been excluded from this website. Prices displayed on all Sold listings are the Last Known Listing Price and may not be the actual selling price.
Based on information submitted to the MLS Grid. All data is obtained from various sources and may not have been verified by broker or MLS GRID. Supplied Open House Information is subject to change without notice. All information should be independently reviewed and verified for accuracy. Properties may or may not be listed by the office/agent presenting the information. Some IDX listings have been excluded from this website. Prices displayed on all Sold listings are the Last Known Listing Price and may not be the actual selling price.
Listing Information presented by local MLS brokerage: TEN-X, INC., local REALTOR®- Arlene Richardson - (888) 952-6393
Based on information submitted to the MLS GRID.
Ask me questions while you tour the home.