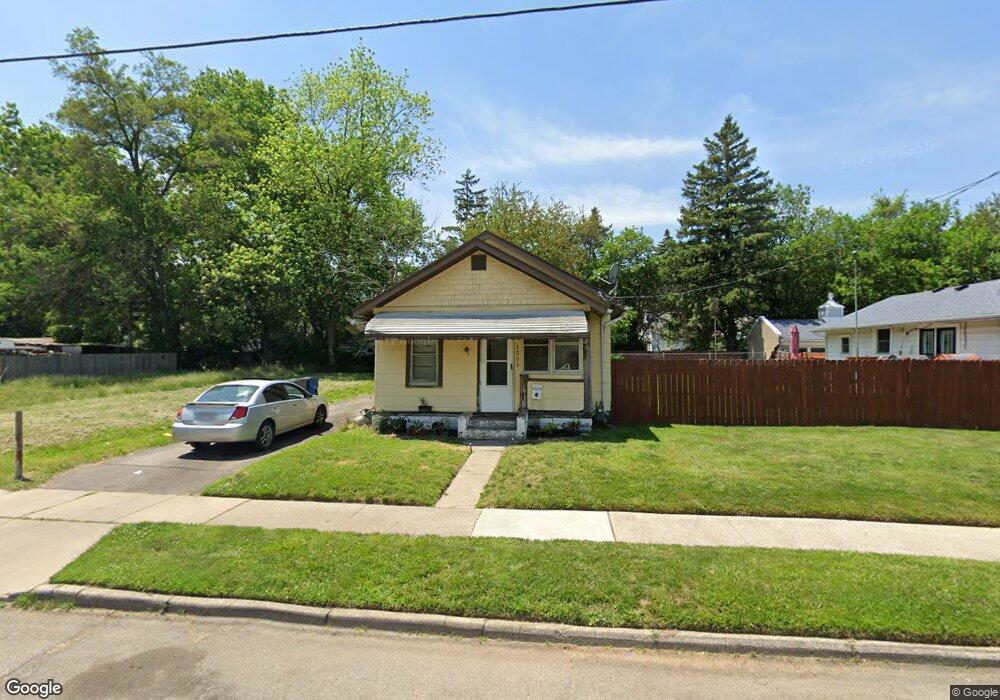
1005 Elysian Ave Toledo, OH 43607
Scott Park NeighborhoodEstimated Value: $48,000 - $84,447
3
Beds
1
Bath
818
Sq Ft
$92/Sq Ft
Est. Value
About This Home
This home is located at 1005 Elysian Ave, Toledo, OH 43607 and is currently estimated at $75,112, approximately $91 per square foot. 1005 Elysian Ave is a home located in Lucas County with nearby schools including Keyser Elementary School, Rogers High School, and Victory Academy of Toledo.
Ownership History
Date
Name
Owned For
Owner Type
Purchase Details
Closed on
Aug 17, 2023
Sold by
Toledo Turnkey Llc
Bought by
Anderson R Todd
Current Estimated Value
Purchase Details
Closed on
Aug 5, 2011
Sold by
Smith David W and Smith Debra J
Bought by
Sun Jingwei
Purchase Details
Closed on
Aug 4, 2011
Sold by
Sherry Brandon L
Bought by
Sun Jingwei
Purchase Details
Closed on
Aug 7, 2001
Sold by
Stubbs Heather E and Stubbs Michael C
Bought by
Smith David W and Smith Debra J
Home Financials for this Owner
Home Financials are based on the most recent Mortgage that was taken out on this home.
Original Mortgage
$33,750
Interest Rate
7.28%
Purchase Details
Closed on
Mar 24, 2000
Sold by
Napholz Michael E Tr
Bought by
Stubbs Michael C and Stubbs Heather E
Home Financials for this Owner
Home Financials are based on the most recent Mortgage that was taken out on this home.
Original Mortgage
$21,150
Interest Rate
9.37%
Purchase Details
Closed on
Oct 4, 1990
Sold by
Napholz Michael E
Create a Home Valuation Report for This Property
The Home Valuation Report is an in-depth analysis detailing your home's value as well as a comparison with similar homes in the area
Home Values in the Area
Average Home Value in this Area
Purchase History
| Date | Buyer | Sale Price | Title Company |
|---|---|---|---|
| Anderson R Todd | $79,900 | None Listed On Document | |
| Toledo Turnkey Llc | $40,000 | None Listed On Document | |
| Sun Jingwei | $26,000 | Chicago Title Insurance Co | |
| Sun Jingwei | $26,000 | Chicago Title Insurance Co | |
| Smith David W | $37,500 | Northwest Title Agency Of Oh | |
| Stubbs Michael C | $23,500 | Northwest Title Agency Of Oh | |
| -- | -- | -- |
Source: Public Records
Mortgage History
| Date | Status | Borrower | Loan Amount |
|---|---|---|---|
| Previous Owner | Smith David W | $33,750 | |
| Previous Owner | Stubbs Michael C | $21,150 |
Source: Public Records
Tax History
| Year | Tax Paid | Tax Assessment Tax Assessment Total Assessment is a certain percentage of the fair market value that is determined by local assessors to be the total taxable value of land and additions on the property. | Land | Improvement |
|---|---|---|---|---|
| 2025 | -- | $15,120 | $3,500 | $11,620 |
| 2024 | $494 | $15,120 | $3,500 | $11,620 |
| 2023 | $456 | $5,810 | $3,150 | $2,660 |
| 2022 | $459 | $5,810 | $3,150 | $2,660 |
| 2021 | $456 | $5,810 | $3,150 | $2,660 |
| 2020 | $487 | $5,390 | $2,905 | $2,485 |
| 2019 | $468 | $5,390 | $2,905 | $2,485 |
| 2018 | $798 | $5,390 | $2,905 | $2,485 |
| 2017 | $6,462 | $14,420 | $2,835 | $11,585 |
| 2016 | $4,671 | $41,200 | $8,100 | $33,100 |
| 2015 | $1,120 | $41,200 | $8,100 | $33,100 |
| 2014 | $1,358 | $14,430 | $2,840 | $11,590 |
| 2013 | $907 | $14,430 | $2,840 | $11,590 |
Source: Public Records
Map
Nearby Homes
- 914 Turner Ave
- 2925 Avondale Ave
- 834 Broer Ave
- 638 Broer Ave
- 714 Brookley Blvd
- 712 Underwood Ave
- 820 MacKow Dr
- 1408 Roosevelt Ave
- 508 Ascot Ave
- 336 Conrad Ave
- 1125 Secor Rd
- 1011 Alldays Ave
- 615 Cuthbert Rd
- 913 Coventry Ave
- 1814 Alvin St
- 811 N University Ave
- 1901 Alvin St
- 1917 Alvin St
- 710 N Byrne Rd
- 1732 Evansdale Ave
- 1001 Elysian Ave
- 929 Elysian Ave
- 1011 Elysian Ave
- 925 Elysian Ave
- 1002 Turner Ave
- 1006 Turner Ave
- 932 Turner Ave
- 1010 Turner Ave
- 921 Elysian Ave
- 1019 Elysian Ave
- 928 Turner Ave
- 1002 Elysian Ave
- 1012 Turner Ave
- 1010 Elysian Ave
- 919 Elysian Ave
- 924 Turner Ave
- 930 Elysian Ave
- 926 Elysian Ave
- 1023 Elysian Ave
- 1012 Elysian Ave
Your Personal Tour Guide
Ask me questions while you tour the home.