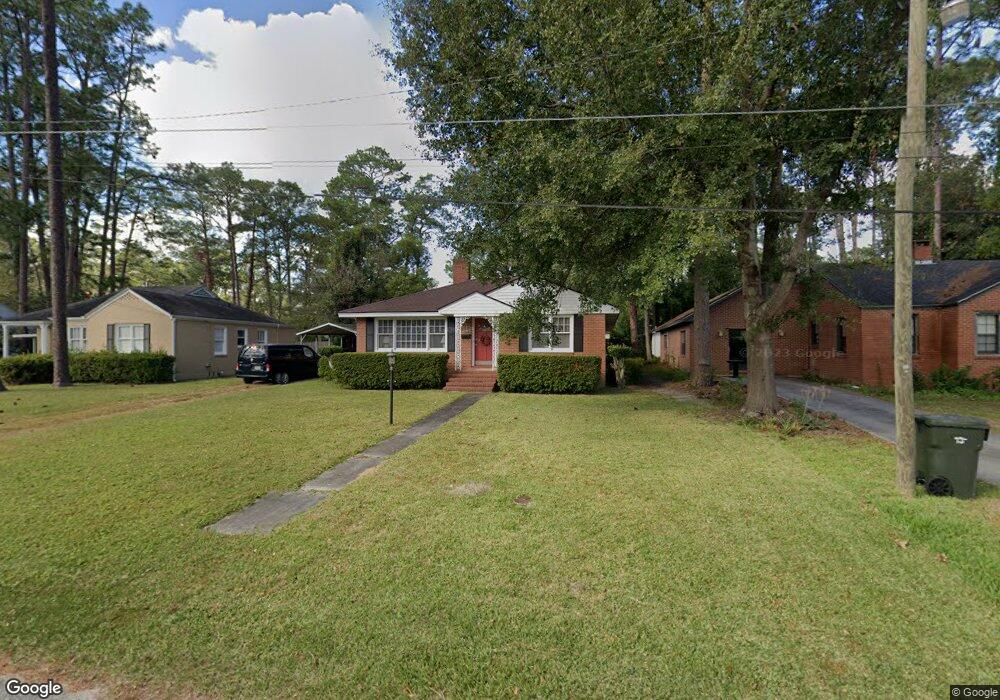
1005 Euclid Ave Waycross, GA 31501
Estimated Value: $140,086 - $192,000
3
Beds
2
Baths
1,710
Sq Ft
$98/Sq Ft
Est. Value
About This Home
This home is located at 1005 Euclid Ave, Waycross, GA 31501 and is currently estimated at $168,022, approximately $98 per square foot. 1005 Euclid Ave is a home located in Ware County with nearby schools including Williams Heights Elementary School, Waycross Middle School, and Ware County High School.
Ownership History
Date
Name
Owned For
Owner Type
Purchase Details
Closed on
Jul 19, 2019
Sold by
Lisher Cynthia Ann Estate
Bought by
Smith David Wayne
Current Estimated Value
Home Financials for this Owner
Home Financials are based on the most recent Mortgage that was taken out on this home.
Original Mortgage
$106,400
Outstanding Balance
$93,177
Interest Rate
3.8%
Mortgage Type
New Conventional
Estimated Equity
$74,845
Purchase Details
Closed on
Sep 28, 2009
Sold by
Christmann John T
Bought by
Lisher Cynthia A
Home Financials for this Owner
Home Financials are based on the most recent Mortgage that was taken out on this home.
Original Mortgage
$86,000
Interest Rate
5.1%
Mortgage Type
New Conventional
Purchase Details
Closed on
Sep 13, 2006
Sold by
Nunn Rowell D
Bought by
Christmann John T
Home Financials for this Owner
Home Financials are based on the most recent Mortgage that was taken out on this home.
Original Mortgage
$14,420
Interest Rate
6.48%
Mortgage Type
New Conventional
Create a Home Valuation Report for This Property
The Home Valuation Report is an in-depth analysis detailing your home's value as well as a comparison with similar homes in the area
Home Values in the Area
Average Home Value in this Area
Purchase History
| Date | Buyer | Sale Price | Title Company |
|---|---|---|---|
| Smith David Wayne | $112,000 | -- | |
| Lisher Cynthia A | $107,500 | -- | |
| Christmann John T | $72,100 | -- |
Source: Public Records
Mortgage History
| Date | Status | Borrower | Loan Amount |
|---|---|---|---|
| Open | Smith David Wayne | $106,400 | |
| Previous Owner | Lisher Cynthia A | $86,000 | |
| Previous Owner | Christmann John T | $14,420 |
Source: Public Records
Tax History Compared to Growth
Tax History
| Year | Tax Paid | Tax Assessment Tax Assessment Total Assessment is a certain percentage of the fair market value that is determined by local assessors to be the total taxable value of land and additions on the property. | Land | Improvement |
|---|---|---|---|---|
| 2024 | $1,394 | $41,263 | $4,320 | $36,943 |
| 2023 | $1,423 | $38,114 | $4,032 | $34,082 |
| 2022 | $1,519 | $38,114 | $4,032 | $34,082 |
| 2021 | $1,364 | $31,541 | $4,032 | $27,509 |
| 2020 | $1,317 | $30,215 | $4,032 | $26,183 |
| 2019 | $1,183 | $28,226 | $4,032 | $24,194 |
| 2018 | $1,158 | $27,397 | $4,032 | $23,365 |
| 2017 | $1,129 | $27,397 | $4,032 | $23,365 |
| 2016 | $1,129 | $27,397 | $4,032 | $23,365 |
| 2015 | $1,137 | $27,397 | $4,032 | $23,365 |
| 2014 | $1,136 | $27,398 | $4,032 | $23,365 |
| 2013 | -- | $28,997 | $4,032 | $24,964 |
Source: Public Records
Map
Nearby Homes
- 1009 Euclid Ave
- 907 Euclid Ave
- 1001 Baltimore Ave
- 1100 Euclid Ave
- 1001 Coral Rd
- 1205 Dean Dr
- 805 Baltimore Ave
- 707 Euclid Ave
- 1100 Atlantic Ave
- 00 Seminole Trail
- 1204 Richmond Ave
- 1002 Cherokee Cir
- 804 Cherokee Cir
- 1011 Cherokee Cir
- 706 Cherokee Cir
- 1400 E Cherokee Dr
- Lot 3 City Blvd
- 713 Magnolia Dr
- 1715 City Blvd
- 1103 Kontz Ave
- 1007 Euclid Ave
- 1003 Euclid Ave
- 1404 Tupelo Dr
- 1001 Euclid Ave
- 1008 Coral Rd
- 1002 Coral Rd
- 1011 Euclid Ave
- 1010 Coral Rd
- 1004 Euclid Ave
- 1405 Dean Dr
- 1406 Tupelo Dr
- 1008 Euclid Ave
- 1000 Euclid Ave
- 909 Euclid Ave
- 1013 Euclid Ave
- 1012 Euclid Ave
- 1407 Dean Dr
- 1405 Tupelo Dr
- 1014 Euclid Ave
- 914 Euclid Ave