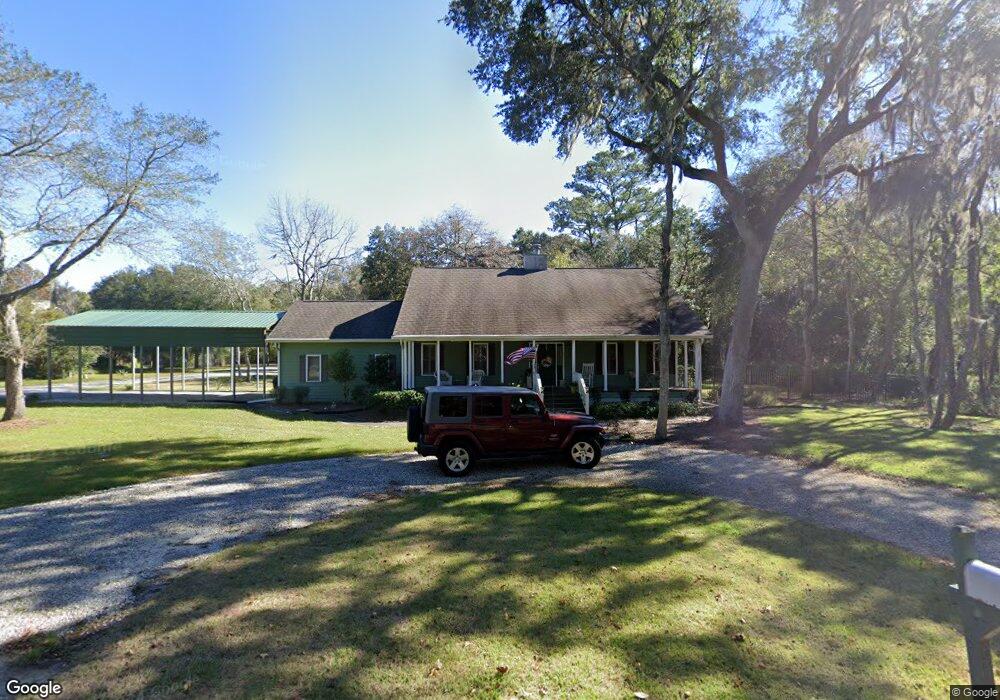
1005 Kelsey Way Darien, GA 31305
Estimated Value: $267,339 - $335,000
3
Beds
3
Baths
1,416
Sq Ft
$218/Sq Ft
Est. Value
About This Home
This home is located at 1005 Kelsey Way, Darien, GA 31305 and is currently estimated at $308,835, approximately $218 per square foot. 1005 Kelsey Way is a home located in McIntosh County with nearby schools including Todd Grant Elementary School, McIntosh County Middle School, and McIntosh County Academy.
Ownership History
Date
Name
Owned For
Owner Type
Purchase Details
Closed on
Aug 30, 2017
Sold by
Liotta Joseph
Bought by
Gilkey Randall W
Current Estimated Value
Home Financials for this Owner
Home Financials are based on the most recent Mortgage that was taken out on this home.
Original Mortgage
$181,291
Outstanding Balance
$151,513
Interest Rate
3.93%
Mortgage Type
VA
Estimated Equity
$157,322
Purchase Details
Closed on
May 20, 2015
Sold by
Liotta Joseph
Bought by
Liotta Joseph and Angel Michael E
Purchase Details
Closed on
Dec 31, 2012
Sold by
Morley Elise
Bought by
Liotta Joseph
Home Financials for this Owner
Home Financials are based on the most recent Mortgage that was taken out on this home.
Original Mortgage
$122,500
Interest Rate
3.36%
Mortgage Type
VA
Purchase Details
Closed on
Mar 25, 2011
Sold by
Morley John Francesca
Bought by
Morley Elise Jeffrey
Purchase Details
Closed on
May 10, 2002
Sold by
Colonial Real Estate
Bought by
Morley Warren and Morley Francesca
Create a Home Valuation Report for This Property
The Home Valuation Report is an in-depth analysis detailing your home's value as well as a comparison with similar homes in the area
Home Values in the Area
Average Home Value in this Area
Purchase History
| Date | Buyer | Sale Price | Title Company |
|---|---|---|---|
| Gilkey Randall W | $175,500 | -- | |
| Liotta Joseph | -- | -- | |
| Liotta Joseph | $122,500 | -- | |
| Morley Elise Jeffrey | -- | -- | |
| Morley Warren | $20,000 | -- |
Source: Public Records
Mortgage History
| Date | Status | Borrower | Loan Amount |
|---|---|---|---|
| Open | Gilkey Randall W | $181,291 | |
| Previous Owner | Liotta Joseph | $122,500 |
Source: Public Records
Tax History Compared to Growth
Tax History
| Year | Tax Paid | Tax Assessment Tax Assessment Total Assessment is a certain percentage of the fair market value that is determined by local assessors to be the total taxable value of land and additions on the property. | Land | Improvement |
|---|---|---|---|---|
| 2024 | $2,417 | $107,320 | $2,760 | $104,560 |
| 2023 | $2,423 | $102,800 | $2,760 | $100,040 |
| 2022 | $1,929 | $86,080 | $2,560 | $83,520 |
| 2021 | $2,025 | $66,680 | $2,560 | $64,120 |
| 2020 | $2,006 | $65,800 | $2,560 | $63,240 |
| 2019 | $1,932 | $66,960 | $8,000 | $58,960 |
| 2018 | $2,034 | $66,960 | $8,000 | $58,960 |
| 2017 | $1,712 | $57,280 | $8,000 | $49,280 |
| 2016 | $1,342 | $57,280 | $8,000 | $49,280 |
| 2015 | $1,318 | $46,780 | $4,000 | $42,780 |
| 2014 | -- | $46,780 | $4,000 | $42,780 |
Source: Public Records
Map
Nearby Homes
- LOT 28 Black Island Rd
- 1006 Oglethorpe Ln
- 1103 E Broad St
- 15914 Hwy 99
- 800 Wayne St
- 1106 Alabama St
- Lot 5 Black
- 505 Madison St
- 1001 Poppell Dr
- 410 Munro St
- 2101 Black Rd
- 309 Haven Dr
- 1048 Austin Place
- 1602 Ashantilly Dr
- 282 Bridgewater Ln
- 1658 Ashantilly Dr
- 10 Garrison St
- Tract B 38 Acres
- 0 Georgia 99 Unit 1648162
- 0 Georgia 99 Unit 1647831
- 1005 Kelseys Way
- 503 Shelby Ct
- 1003 Kelsey Way
- 503 Shelby Ct
- Lot 10 Kelsey Way
- Lot 1 Kelsey Way
- Lot 13 Kelsey Way
- Lot 19 Kelsey Way
- Lot 4 Kelsey Way
- Lot 7 Kelsey Way
- Lot 5 Kelsey Way
- Lot 12 Kelsey Way
- Lot 6 Kelsey Way
- 1004 Kelsey Way
- 1101 Kelseys Way
- 1101 Kelsey Way
- 504 Shelby Ct
- 1001 Kelsey Way
- 1000 Kelsey Way
- Lot 16 Shelby Ct