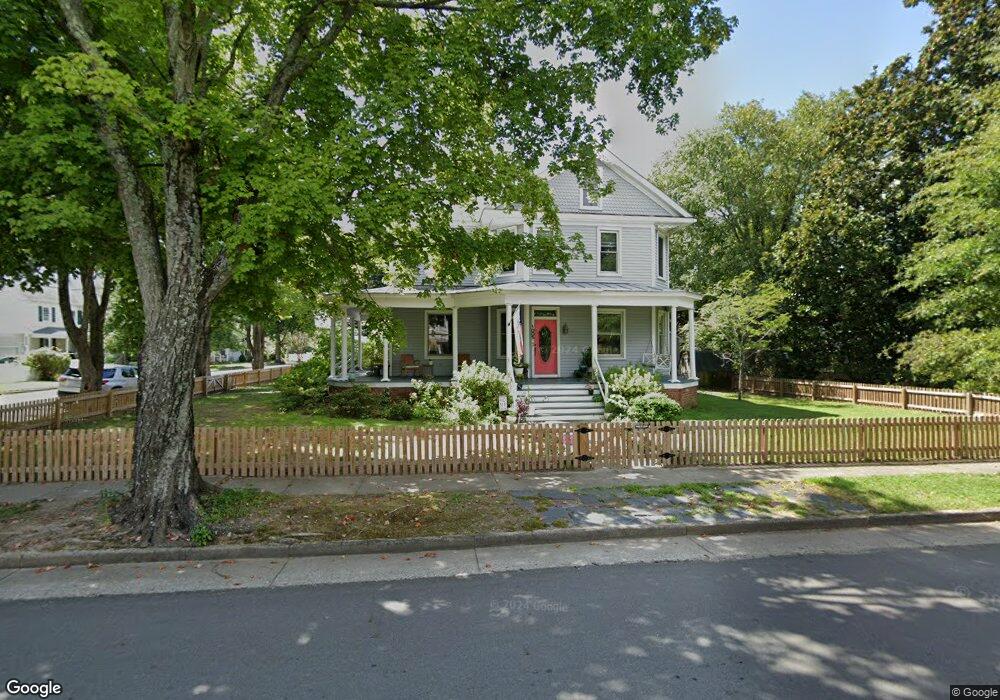
1005 Lee St West Point, VA 23181
West Point AreaEstimated Value: $332,000 - $405,939
About This Home
This home is located at 1005 Lee St, West Point, VA 23181 and is currently estimated at $377,485, approximately $120 per square foot. 1005 Lee St is a home located in King William County with nearby schools including West Point Elementary School, West Point Middle School, and West Point High School.
Ownership History
We collect this data history from publicly available records. To have your information removed, we recommend requesting removal directly through your county’s website.
Purchase Details
Home Financials for this Owner
Home Financials are based on the most recent Mortgage that was taken out on this home.Home Values in the Area
Average Home Value in this Area
Purchase History
We collect this data history from publicly available records. To have your information removed, we recommend requesting removal directly through your county’s website.
| Date | Buyer | Sale Price | Title Company |
|---|---|---|---|
| $290,000 | Fidelity National Title |
Mortgage History
We collect this data history from publicly available records. To have your information removed, we recommend requesting removal directly through your county’s website.
| Date | Status | Borrower | Loan Amount |
|---|---|---|---|
| Open | $250,000 |
Tax History
We collect this data history from publicly available records. To have your information removed, we recommend requesting removal directly through your county’s website.
| Year | Tax Paid | Tax Assessment Tax Assessment Total Assessment is a certain percentage of the fair market value that is determined by local assessors to be the total taxable value of land and additions on the property. | Land | Improvement |
|---|---|---|---|---|
| 2025 | $891 | $292,200 | $60,000 | $232,200 |
| 2024 | $789 | $292,200 | $60,000 | $232,200 |
| 2023 | $789 | $292,200 | $60,000 | $232,200 |
| 2022 | $909 | $242,400 | $60,000 | $182,400 |
| 2021 | $921 | $242,400 | $60,000 | $182,400 |
| 2020 | $921 | $295,700 | $54,000 | $241,700 |
| 2019 | $921 | $231,900 | $60,000 | $171,900 |
| 2018 | $945 | $242,400 | $60,000 | $182,400 |
| 2017 | $982 | $242,400 | $60,000 | $182,400 |
| 2016 | $994 | $242,400 | $60,000 | $182,400 |
| 2015 | $1,042 | $242,400 | $60,000 | $182,400 |
| 2014 | $1,191 | $0 | $0 | $0 |
Map
- 1216 Main St
- 819 Kirby St
- 817 Kirby St
- 815 Kirby St
- 0 14th and Kirby St
- 1515 Lee St
- Lot 1767 17 St
- 307 Main St
- 1806 Lee St
- 2509 22nd St
- Lot 23 Glen St
- 520 Bridgeway Ct
- 635 Rivergate Terrace
- 352 Ogden St
- 460 Thompson Ave
- 260 Ogden St
- 7969 Pennsylvania Ave
- 7957 Pennsylvania Ave
- 19612 Plumside Ln
- 2660 N Oak Ln
Ask me questions while you tour the home.