Estimated Value: $92,897 - $128,000
3
Beds
1
Bath
892
Sq Ft
$120/Sq Ft
Est. Value
About This Home
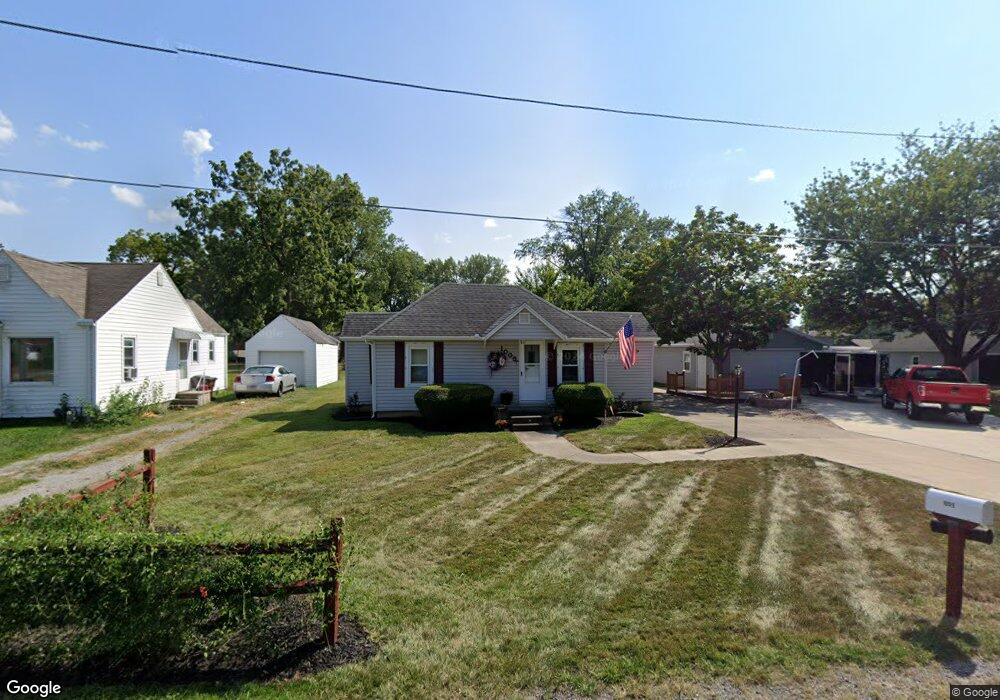
This home is located at 1005 Logan Ave, Lima, OH 45801 and is currently estimated at $106,724, approximately $119 per square foot. 1005 Logan Ave is a home located in Allen County with nearby schools including Heritage Elementary School, Lima North Middle School, and Lima West Middle School.
Ownership History
Date
Name
Owned For
Owner Type
Purchase Details
Closed on
Feb 16, 2012
Sold by
H O P E Through Divine Intervention Inc
Bought by
Lamb Fred A and Lamb Gina R
Current Estimated Value
Purchase Details
Closed on
Nov 7, 2011
Sold by
Us Bank National Association
Bought by
H O P E Through Divine Intervention Inc
Purchase Details
Closed on
Sep 9, 2011
Sold by
Boedicker Michele A
Bought by
Us Bank National Association
Purchase Details
Closed on
Jul 11, 1994
Sold by
Boedicker Edward
Bought by
Boedicker Michelle
Home Financials for this Owner
Home Financials are based on the most recent Mortgage that was taken out on this home.
Original Mortgage
$17,500
Interest Rate
8.61%
Mortgage Type
New Conventional
Purchase Details
Closed on
Oct 1, 1984
Bought by
Boedicker Edward G
Create a Home Valuation Report for This Property
The Home Valuation Report is an in-depth analysis detailing your home's value as well as a comparison with similar homes in the area
Purchase History
| Date | Buyer | Sale Price | Title Company |
|---|---|---|---|
| Lamb Fred A | $12,000 | Attorney | |
| H O P E Through Divine Intervention Inc | -- | Change Of Title Inc | |
| Us Bank National Association | $18,000 | None Available | |
| Boedicker Michelle | $17,500 | -- | |
| Boedicker Edward G | $18,800 | -- |
Source: Public Records
Mortgage History
| Date | Status | Borrower | Loan Amount |
|---|---|---|---|
| Previous Owner | Boedicker Michelle | $17,500 |
Source: Public Records
Tax History
| Year | Tax Paid | Tax Assessment Tax Assessment Total Assessment is a certain percentage of the fair market value that is determined by local assessors to be the total taxable value of land and additions on the property. | Land | Improvement |
|---|---|---|---|---|
| 2024 | $927 | $23,980 | $2,590 | $21,390 |
| 2023 | $950 | $20,830 | $2,240 | $18,590 |
| 2022 | $956 | $20,830 | $2,240 | $18,590 |
| 2021 | $1,008 | $20,830 | $2,240 | $18,590 |
| 2020 | $973 | $17,680 | $2,940 | $14,740 |
| 2019 | $973 | $17,680 | $2,940 | $14,740 |
| 2018 | $959 | $17,680 | $2,940 | $14,740 |
| 2017 | $690 | $12,290 | $2,940 | $9,350 |
| 2016 | $695 | $12,290 | $2,940 | $9,350 |
| 2015 | $668 | $12,290 | $2,940 | $9,350 |
| 2014 | $668 | $11,630 | $2,630 | $9,000 |
| 2013 | $605 | $11,630 | $2,630 | $9,000 |
Source: Public Records
Map
Nearby Homes
- 1027 Sherman Ave
- 760 W O'Connor Ave
- 745 Ewing Ave
- 1015 N Cole St
- 0 Latham
- 1164 Bahama Dr
- 841 N Baxter St
- 645 W O'Connor Ave
- 1245 Latham Ave
- 949 Leland Ave
- 631 Hazel Ave
- 816 N Baxter St
- 608 W O'Connor Ave
- 1407 Latham Ave
- 824 Rice Ave
- 703 N Collett St
- 1580 W Robb Ave
- 576 W Ashton Ave
- 557 W Ashton Ave
- 618 Woodward Ave
Your Personal Tour Guide
Ask me questions while you tour the home.