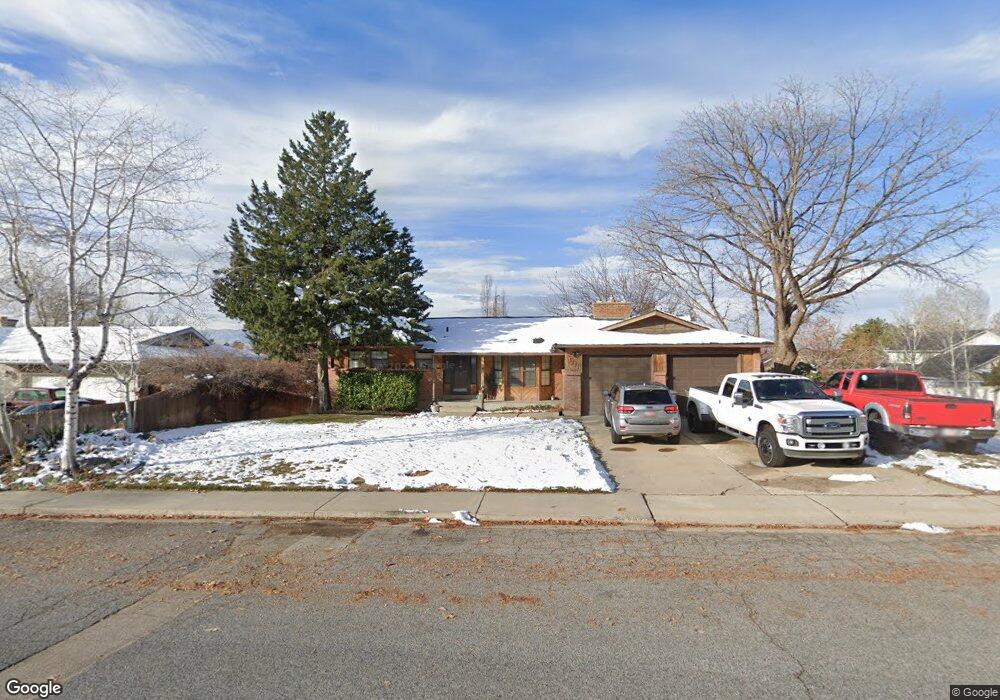
1005 N 1020 E Pleasant Grove, UT 84062
Estimated Value: $532,000 - $683,000
3
Beds
2
Baths
2,548
Sq Ft
$232/Sq Ft
Est. Value
About This Home
This home is located at 1005 N 1020 E, Pleasant Grove, UT 84062 and is currently estimated at $591,568, approximately $232 per square foot. 1005 N 1020 E is a home located in Utah County with nearby schools including Grovecrest Elementary School, Pleasant Grove Junior High School, and Pleasant Grove High School.
Ownership History
Date
Name
Owned For
Owner Type
Purchase Details
Closed on
Nov 18, 2024
Sold by
Mortenson Julianne and Mortenson Cory
Bought by
Storrs Nicole and Storrs Riley
Current Estimated Value
Home Financials for this Owner
Home Financials are based on the most recent Mortgage that was taken out on this home.
Original Mortgage
$514,100
Outstanding Balance
$506,861
Interest Rate
6.12%
Mortgage Type
New Conventional
Estimated Equity
$84,707
Purchase Details
Closed on
Nov 12, 2018
Sold by
Eyre H Tracy and Eyre Betty L
Bought by
Mortenson Julianne and Mortenson Cory
Home Financials for this Owner
Home Financials are based on the most recent Mortgage that was taken out on this home.
Original Mortgage
$333,000
Interest Rate
4.7%
Mortgage Type
New Conventional
Purchase Details
Closed on
Jun 1, 2016
Sold by
Eyre Tracy H and Eyre Betty L
Bought by
Eyre Tracy H and Eyre Betty L
Create a Home Valuation Report for This Property
The Home Valuation Report is an in-depth analysis detailing your home's value as well as a comparison with similar homes in the area
Home Values in the Area
Average Home Value in this Area
Purchase History
We collect this data history from publicly available records. To have your information removed, we recommend requesting removal directly through your county’s website.
| Date | Buyer | Sale Price | Title Company |
|---|---|---|---|
| Storrs Nicole | -- | Inwest Title | |
| Mortenson Julianne | -- | Stewart Title Ins Agency Of | |
| Eyre Tracy H | -- | None Available |
Source: Public Records
Mortgage History
We collect this data history from publicly available records. To have your information removed, we recommend requesting removal directly through your county’s website.
| Date | Status | Borrower | Loan Amount |
|---|---|---|---|
| Open | Storrs Nicole | $514,100 | |
| Previous Owner | Mortenson Julianne | $333,000 |
Source: Public Records
Tax History
| Year | Tax Paid | Tax Assessment Tax Assessment Total Assessment is a certain percentage of the fair market value that is determined by local assessors to be the total taxable value of land and additions on the property. | Land | Improvement |
|---|---|---|---|---|
| 2025 | $2,096 | $274,120 | -- | -- |
| 2024 | $2,096 | $250,085 | $0 | $0 |
| 2023 | $2,017 | $246,455 | $0 | $0 |
| 2022 | $2,024 | $246,070 | $0 | $0 |
| 2021 | $1,820 | $336,800 | $165,100 | $171,700 |
| 2020 | $1,665 | $302,100 | $147,400 | $154,700 |
| 2019 | $1,571 | $294,800 | $140,100 | $154,700 |
| 2018 | $1,506 | $267,200 | $132,700 | $134,500 |
| 2017 | $1,438 | $135,795 | $0 | $0 |
| 2016 | $1,321 | $120,450 | $0 | $0 |
| 2015 | $1,337 | $115,500 | $0 | $0 |
| 2014 | $1,252 | $107,140 | $0 | $0 |
Source: Public Records
Map
Nearby Homes
Your Personal Tour Guide
Ask me questions while you tour the home.