Estimated Value: $568,183 - $675,000
Studio
3
Baths
2,316
Sq Ft
$269/Sq Ft
Est. Value
About This Home
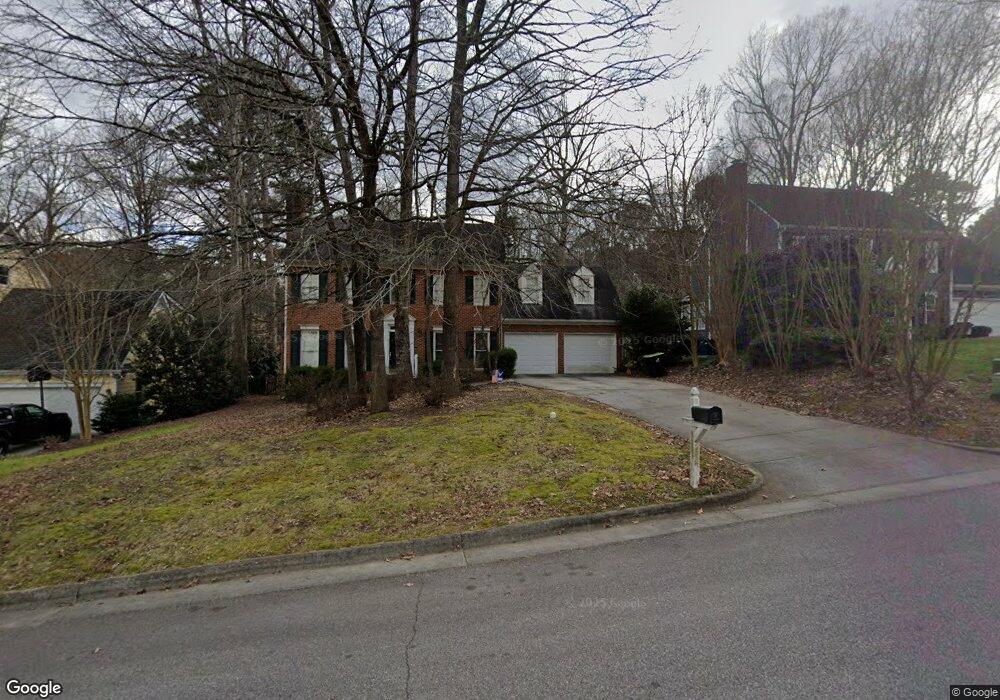
This home is located at 1005 New Dover Rd Unit (UnitID 3430892), Apex, NC 27502 and is currently estimated at $622,546, approximately $268 per square foot. 1005 New Dover Rd Unit (UnitID 3430892) is a home located in Wake County with nearby schools including Apex Elementary School, Apex Middle, and Apex High School.
Ownership History
Date
Name
Owned For
Owner Type
Purchase Details
Closed on
Jul 7, 2005
Sold by
Tindall Edward B and Tindall Faye W
Bought by
Lau Sophia
Current Estimated Value
Home Financials for this Owner
Home Financials are based on the most recent Mortgage that was taken out on this home.
Original Mortgage
$201,600
Outstanding Balance
$75,389
Interest Rate
1.37%
Mortgage Type
Fannie Mae Freddie Mac
Estimated Equity
$547,157
Purchase Details
Closed on
Mar 27, 2001
Sold by
Ruth Michael J
Bought by
Tindal Edward B and Tindal Faye W
Home Financials for this Owner
Home Financials are based on the most recent Mortgage that was taken out on this home.
Original Mortgage
$180,000
Interest Rate
7.02%
Create a Home Valuation Report for This Property
The Home Valuation Report is an in-depth analysis detailing your home's value as well as a comparison with similar homes in the area
Purchase History
| Date | Buyer | Sale Price | Title Company |
|---|---|---|---|
| Lau Sophia | $252,500 | -- | |
| Tindal Edward B | $200,000 | -- |
Source: Public Records
Mortgage History
| Date | Status | Borrower | Loan Amount |
|---|---|---|---|
| Open | Lau Sophia | $201,600 | |
| Previous Owner | Tindal Edward B | $180,000 |
Source: Public Records
Tax History
| Year | Tax Paid | Tax Assessment Tax Assessment Total Assessment is a certain percentage of the fair market value that is determined by local assessors to be the total taxable value of land and additions on the property. | Land | Improvement |
|---|---|---|---|---|
| 2025 | $4,856 | $553,839 | $200,000 | $353,839 |
| 2024 | $4,747 | $553,839 | $200,000 | $353,839 |
Source: Public Records
Map
Nearby Homes
- 117 Altair Cir
- 119 Heatherwood Dr
- 2365 Englemann Dr Unit Lot 129
- 3123 June Lake Station Unit Lot 215
- 2361 Englemann Dr
- 2374 Englemann Dr
- 2369 Englemann Dr Unit Lot 130
- 2374 Englemann Dr Unit Lot 105
- 2361 Englemann Dr Unit Lot 131
- 2350 Englemann Dr Unit Lot 99
- 2365 Englemann Dr
- 2354 Englemann Dr Unit Lot 100
- 2354 Englemann Dr
- 2357 Englemann Dr Unit Lot 132
- 2282 Apex Peakway
- 2284 Apex Peakway
- 2286 Apex Peakway
- 514 Mill Hopper Ln
- 2288 Apex Peakway
- 2290 Apex Peakway
- 1005 New Dover Rd
- 1003 New Dover Rd
- 1007 New Dover Rd
- 1001 New Dover Rd
- 1009 New Dover Rd
- 1004 New Dover Rd
- 1002 New Dover Rd
- 2001 Bridgeham Way
- 1011 New Dover Rd
- 1000 New Dover Rd
- 3000 Elmstead Ct
- 2003 Bridgeham Way
- 1013 New Dover Rd
- 1301 Empty Nest Way
- 3002 Elmstead Ct
- 2005 Bridgeham Way
- 1015 New Dover Rd
- 1014 Chickering Ct
- 1300 Empty Nest Way
- 2004 Bridgeham Way
Your Personal Tour Guide
Ask me questions while you tour the home.