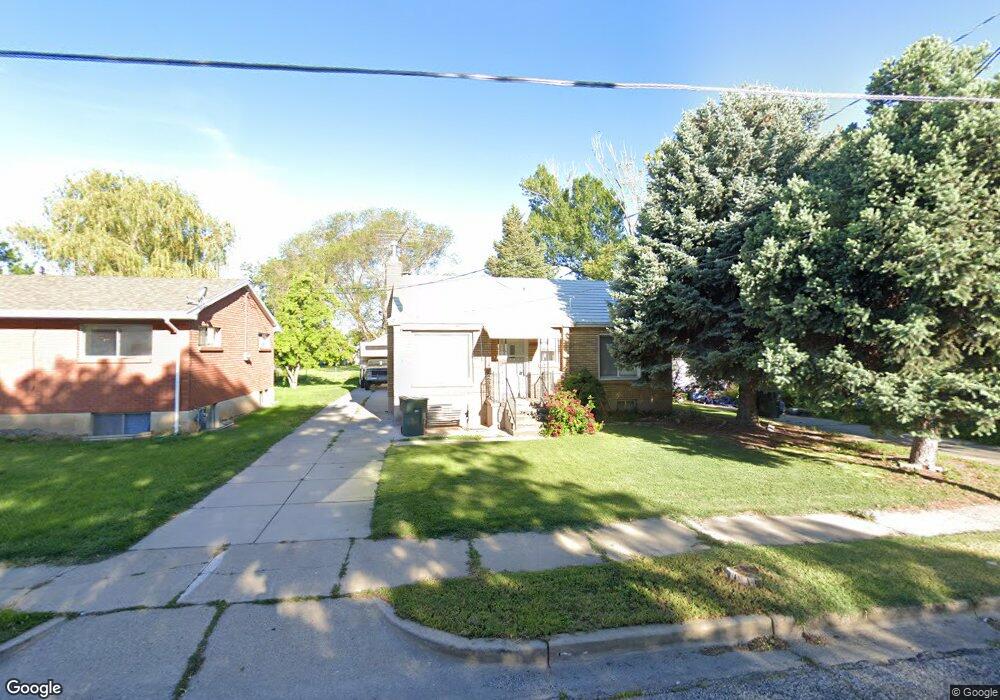
1005 Porter Ave Ogden, UT 84404
Hillcrest-Bonneville NeighborhoodEstimated Value: $312,000 - $357,604
3
Beds
2
Baths
1,704
Sq Ft
$198/Sq Ft
Est. Value
About This Home
This home is located at 1005 Porter Ave, Ogden, UT 84404 and is currently estimated at $338,151, approximately $198 per square foot. 1005 Porter Ave is a home located in Weber County with nearby schools including Bonneville School, Highland Junior High School, and Ben Lomond High School.
Ownership History
Date
Name
Owned For
Owner Type
Purchase Details
Closed on
Sep 12, 2008
Sold by
Hales James W and Hales Nancy B
Bought by
Mcbride Joseph
Current Estimated Value
Home Financials for this Owner
Home Financials are based on the most recent Mortgage that was taken out on this home.
Original Mortgage
$130,945
Outstanding Balance
$87,013
Interest Rate
6.5%
Mortgage Type
FHA
Estimated Equity
$251,138
Purchase Details
Closed on
May 4, 2005
Sold by
Andrews Mary Lou Byrne and Byrne Steven Glenn
Bought by
Hales James W and Hales Nancy B
Home Financials for this Owner
Home Financials are based on the most recent Mortgage that was taken out on this home.
Original Mortgage
$73,775
Interest Rate
5.99%
Mortgage Type
Fannie Mae Freddie Mac
Purchase Details
Closed on
Oct 31, 2002
Sold by
Byrne Arlene J
Bought by
Andrews Mary Lou Byrne and Byrne Steven Glenn
Purchase Details
Closed on
Sep 18, 1996
Sold by
Byrne Glenn L and Byrne Arlene J
Bought by
Byrne Glenn L and Byrne Arlene J
Create a Home Valuation Report for This Property
The Home Valuation Report is an in-depth analysis detailing your home's value as well as a comparison with similar homes in the area
Home Values in the Area
Average Home Value in this Area
Purchase History
| Date | Buyer | Sale Price | Title Company |
|---|---|---|---|
| Mcbride Joseph | -- | Backman Fptp | |
| Hales James W | -- | Mountain View Title Ogden | |
| Hales James W | -- | Mountain View Title Ogden | |
| Andrews Mary Lou Byrne | -- | -- | |
| Byrne Glenn L | -- | -- |
Source: Public Records
Mortgage History
| Date | Status | Borrower | Loan Amount |
|---|---|---|---|
| Open | Mcbride Joseph | $130,945 | |
| Previous Owner | Hales James W | $73,775 |
Source: Public Records
Tax History Compared to Growth
Tax History
| Year | Tax Paid | Tax Assessment Tax Assessment Total Assessment is a certain percentage of the fair market value that is determined by local assessors to be the total taxable value of land and additions on the property. | Land | Improvement |
|---|---|---|---|---|
| 2025 | $2,276 | $333,642 | $105,015 | $228,627 |
| 2024 | $2,153 | $170,499 | $57,758 | $112,741 |
| 2023 | $2,071 | $165,000 | $52,164 | $112,836 |
| 2022 | $2,410 | $192,500 | $44,002 | $148,498 |
| 2021 | $1,750 | $232,000 | $50,052 | $181,948 |
| 2020 | $1,600 | $196,000 | $39,987 | $156,013 |
| 2019 | $1,565 | $180,000 | $30,057 | $149,943 |
| 2018 | $1,295 | $148,001 | $26,008 | $121,993 |
| 2017 | $1,106 | $118,001 | $26,008 | $91,993 |
| 2016 | $1,126 | $64,988 | $11,909 | $53,079 |
| 2015 | $889 | $50,078 | $11,909 | $38,169 |
| 2014 | $906 | $50,077 | $10,429 | $39,648 |
Source: Public Records
Map
Nearby Homes
- 1107 Jefferson Ave
- 987 S Jefferson Ave
- 968 S Jefferson Ave
- 3564 S Jefferson Ave
- 520 Chester St
- 358 E 11th St
- 868 Washington Blvd
- 1137 Liberty Ave
- 524 14th St
- 1116 Liberty Ave
- 965 Kiesel Ave
- 955 Kiesel Ave
- 740 Adams Ave
- Cove Plan at Midtown Village
- Haven Plan at Midtown Village
- 1324 Liberty Ave
- 347 8th St
- 909 Grant Ave
- 805 12th St
- 1312 Grant Ave