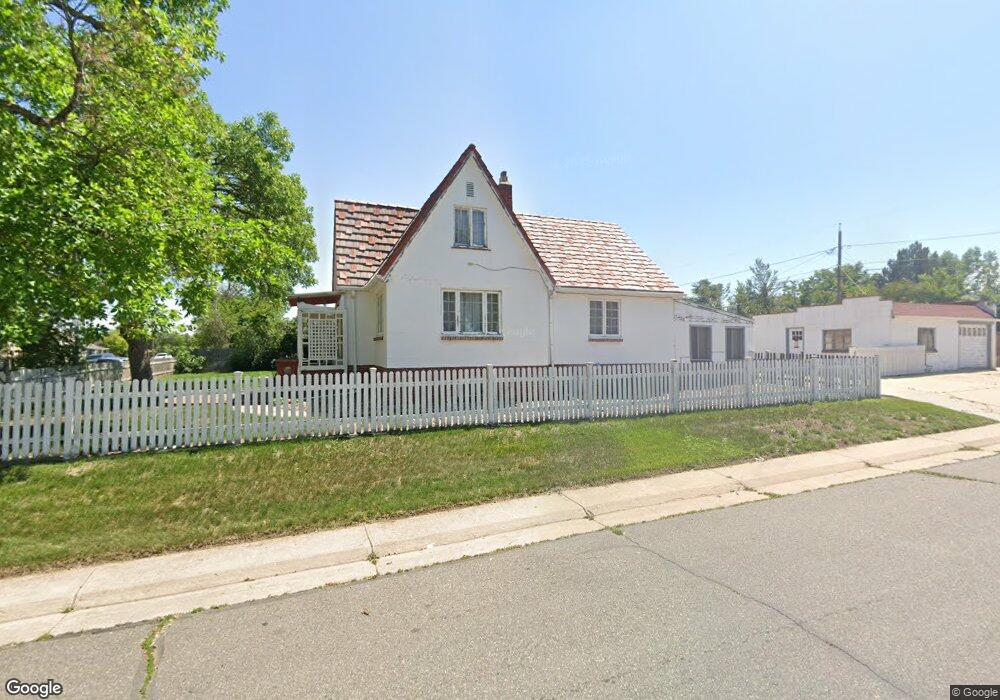
1005 S Perry St Denver, CO 80219
Westwood NeighborhoodEstimated Value: $431,000 - $488,929
4
Beds
2
Baths
1,221
Sq Ft
$371/Sq Ft
Est. Value
About This Home
This home is located at 1005 S Perry St, Denver, CO 80219 and is currently estimated at $452,732, approximately $370 per square foot. 1005 S Perry St is a home located in Denver County with nearby schools including Castro Elementary School, Kepner Beacon Middle School, and West High School.
Ownership History
Date
Name
Owned For
Owner Type
Purchase Details
Closed on
Feb 11, 2019
Sold by
Sandoval Patrick R
Bought by
Shanoski Sandoval Jr Patrick R and Shanoski Sandoval Laurieanne
Current Estimated Value
Home Financials for this Owner
Home Financials are based on the most recent Mortgage that was taken out on this home.
Original Mortgage
$170,000
Outstanding Balance
$147,609
Interest Rate
4.3%
Mortgage Type
New Conventional
Estimated Equity
$305,123
Purchase Details
Closed on
Oct 19, 1998
Sold by
1114 Properties Llc
Bought by
Sandoval Patrick R
Home Financials for this Owner
Home Financials are based on the most recent Mortgage that was taken out on this home.
Original Mortgage
$115,000
Interest Rate
6.73%
Purchase Details
Closed on
May 23, 1998
Sold by
Martin Schreiber and Macherione Daniel
Bought by
1114 Properties Llc
Home Financials for this Owner
Home Financials are based on the most recent Mortgage that was taken out on this home.
Original Mortgage
$73,600
Interest Rate
7.2%
Create a Home Valuation Report for This Property
The Home Valuation Report is an in-depth analysis detailing your home's value as well as a comparison with similar homes in the area
Home Values in the Area
Average Home Value in this Area
Purchase History
| Date | Buyer | Sale Price | Title Company |
|---|---|---|---|
| Shanoski Sandoval Jr Patrick R | -- | Homestead Title And Escrow | |
| Sandoval Patrick R | $145,000 | -- | |
| Sandoval Patrick R | $145,000 | Land Title | |
| 1114 Properties Llc | $75,000 | Land Title |
Source: Public Records
Mortgage History
| Date | Status | Borrower | Loan Amount |
|---|---|---|---|
| Open | Shanoski Sandoval Jr Patrick R | $170,000 | |
| Previous Owner | Sandoval Patrick R | $115,000 | |
| Previous Owner | 1114 Properties Llc | $73,600 |
Source: Public Records
Tax History
| Year | Tax Paid | Tax Assessment Tax Assessment Total Assessment is a certain percentage of the fair market value that is determined by local assessors to be the total taxable value of land and additions on the property. | Land | Improvement |
|---|---|---|---|---|
| 2025 | $2,492 | $31,580 | $17,480 | $17,480 |
| 2024 | $2,492 | $31,470 | $10,040 | $21,430 |
| 2023 | $2,439 | $31,470 | $10,040 | $21,430 |
| 2022 | $1,904 | $23,940 | $13,860 | $10,080 |
| 2021 | $1,838 | $24,630 | $14,260 | $10,370 |
| 2020 | $1,640 | $22,110 | $10,790 | $11,320 |
| 2019 | $1,594 | $22,110 | $10,790 | $11,320 |
| 2018 | $1,316 | $17,010 | $7,760 | $9,250 |
| 2017 | $1,312 | $17,010 | $7,760 | $9,250 |
| 2016 | $1,063 | $13,030 | $7,291 | $5,739 |
Source: Public Records
Map
Nearby Homes
- 1037 S Perry St
- 1050 S Quitman St
- 1060 S Perry St
- 1110 S Quitman St
- 971 S Tennyson St
- 4445 W Tennessee Ave
- 4450 W Kentucky Ave
- 1026 S Newton St
- 3936 W Walsh Place Unit 8
- 950 S Wolff St
- 1165 S Winona Ct
- 971 S Wolff St
- 1145 S Wolff St
- 695 S Newton St
- 3580 W Arizona Ave
- 990 S Meade St
- 3457 W Hoye Place
- 1345 S Utica St
- 4860 W Ohio Ave
- 1415 S Tennyson St
- 1021 S Perry St
- 993 S Perry St
- 1029 S Perry St
- 1000 S Perry St
- 989 S Perry St
- 1004 S Quitman St
- 3975 W Tennessee Ave
- 1020 S Perry St
- 994 S Quitman St
- 1018 S Quitman St
- 1012 S Quitman St
- 1012 S Quitman St
- 973 S Perry St
- 980 S Quitman St
- 980 S Perry St
- 1026 S Perry St
- 1030 S Quitman St
- 1014 S Perry St
- 972 S Quitman St
- 1045 S Perry St
Your Personal Tour Guide
Ask me questions while you tour the home.