1005 Samuel Dr Petaluma, CA 94952
Oakhill Brewster NeighborhoodEstimated Value: $988,000 - $1,044,821
About This Home
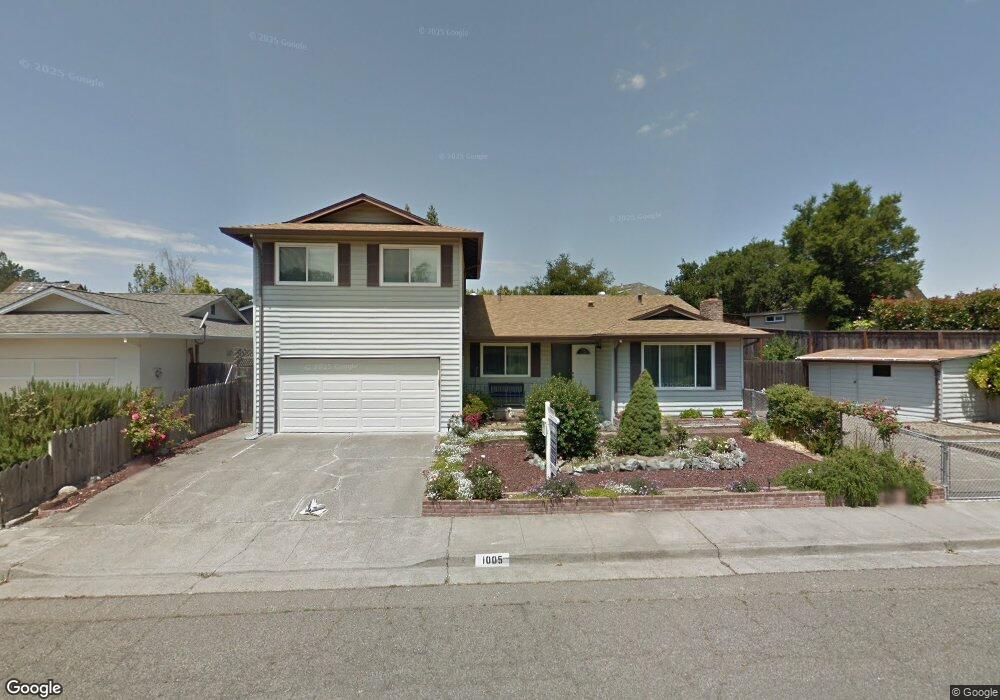
This home is located at 1005 Samuel Dr, Petaluma, CA 94952 and is currently estimated at $1,017,205, approximately $558 per square foot. 1005 Samuel Dr is a home located in Sonoma County with nearby schools including Petaluma Junior High School, Petaluma High School, and Mary Collins Charter School at Cherry Valley.
Ownership History
We collect this data history from publicly available records. To have your information removed, we recommend requesting removal directly through your county’s website.
Purchase Details
Home Financials for this Owner
Home Financials are based on the most recent Mortgage that was taken out on this home.Home Values in the Area
Average Home Value in this Area
Purchase History
We collect this data history from publicly available records. To have your information removed, we recommend requesting removal directly through your county’s website.
| Date | Buyer | Sale Price | Title Company |
|---|---|---|---|
| $600,000 | Fidelity National Title Co |
Mortgage History
We collect this data history from publicly available records. To have your information removed, we recommend requesting removal directly through your county’s website.
| Date | Status | Borrower | Loan Amount |
|---|---|---|---|
| Open | $480,000 |
Tax History
We collect this data history from publicly available records. To have your information removed, we recommend requesting removal directly through your county’s website.
| Year | Tax Paid | Tax Assessment Tax Assessment Total Assessment is a certain percentage of the fair market value that is determined by local assessors to be the total taxable value of land and additions on the property. | Land | Improvement |
|---|---|---|---|---|
| 2025 | $7,944 | $710,271 | $284,107 | $426,164 |
| 2024 | $7,588 | $696,345 | $278,537 | $417,808 |
| 2023 | $7,588 | $682,692 | $273,076 | $409,616 |
| 2022 | $7,386 | $669,307 | $267,722 | $401,585 |
| 2021 | $7,220 | $656,184 | $262,473 | $393,711 |
| 2020 | $7,276 | $649,456 | $259,782 | $389,674 |
| 2019 | $7,161 | $636,723 | $254,689 | $382,034 |
| 2018 | $7,115 | $624,240 | $249,696 | $374,544 |
| 2017 | $7,002 | $612,000 | $244,800 | $367,200 |
| 2016 | $6,782 | $600,000 | $240,000 | $360,000 |
| 2015 | $1,027 | $93,888 | $14,054 | $79,834 |
| 2014 | $989 | $92,050 | $13,779 | $78,271 |
Map
- 1100 Gossage Ave
- 1375 Gossage Ave
- 1104 Birch Dr
- 727 Cindy Ln
- 814 Cobbler Ln
- 835 Liberty St
- 445 Marshall Ave
- 195 Cinnabar Ave
- 495 Cherry St
- 1008 West St
- 1252 Petaluma Blvd N
- 509 Larch Dr
- 513 Larch Dr
- 2212 Magnolia Ave
- 621 Kentucky St
- 440 Rebecca Dr
- 518 Kentucky St
- 717 N Mcdowell Blvd Unit 511
- 717 N Mcdowell Blvd Unit 303
- 12 Dorenfeld Ct
- 1014 Samuel Dr
- 1018 Samuel Dr
- 1010 Samuel Dr
- 955 Gossage Ave
- 957 Gossage Ave
- 1009 Samuel Dr
- 1013 Samuel Dr
- 1022 Samuel Dr
- 1017 Samuel Dr
- 953 Gossage Ave
- 1021 Samuel Dr
- 1204 Kathileen Way
- 1026 Samuel Dr
- 1004 Samuel Dr
- 1001 Samuel Dr
- 1025 Samuel Dr
- 777 Gossage Ave
- 1208 Kathileen Way
- 943 Elm Dr
- 1000 Samuel Dr
Ask me questions while you tour the home.