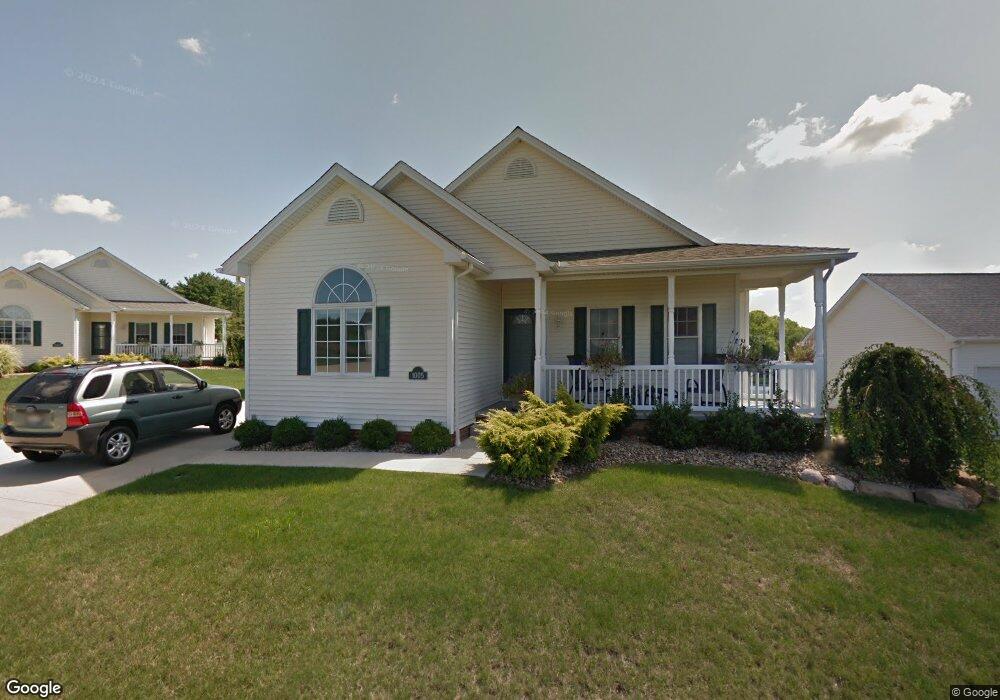
1005 Shovler Ct Unit 1005 North Lima, OH 44452
Estimated Value: $319,825 - $417,000
3
Beds
2
Baths
1,786
Sq Ft
$204/Sq Ft
Est. Value
About This Home
This home is located at 1005 Shovler Ct Unit 1005, North Lima, OH 44452 and is currently estimated at $364,456, approximately $204 per square foot. 1005 Shovler Ct Unit 1005 is a home located in Mahoning County with nearby schools including South Range Elementary School, South Range Middle School, and South Range High School.
Ownership History
Date
Name
Owned For
Owner Type
Purchase Details
Closed on
Jun 8, 2023
Bought by
Robert S Komar
Current Estimated Value
Purchase Details
Closed on
Nov 20, 2007
Sold by
Latessa Construction Ltd
Bought by
Komar Robert S and Komar Mercy A
Home Financials for this Owner
Home Financials are based on the most recent Mortgage that was taken out on this home.
Original Mortgage
$193,400
Interest Rate
6.11%
Mortgage Type
Purchase Money Mortgage
Purchase Details
Closed on
Aug 8, 2007
Bought by
Komar Robert S
Create a Home Valuation Report for This Property
The Home Valuation Report is an in-depth analysis detailing your home's value as well as a comparison with similar homes in the area
Home Values in the Area
Average Home Value in this Area
Purchase History
| Date | Buyer | Sale Price | Title Company |
|---|---|---|---|
| Robert S Komar | -- | -- | |
| Komar Robert S | $193,400 | Quest Title Agency Inc | |
| Komar Robert S | -- | -- |
Source: Public Records
Mortgage History
| Date | Status | Borrower | Loan Amount |
|---|---|---|---|
| Previous Owner | Komar Robert S | $193,400 |
Source: Public Records
Tax History Compared to Growth
Tax History
| Year | Tax Paid | Tax Assessment Tax Assessment Total Assessment is a certain percentage of the fair market value that is determined by local assessors to be the total taxable value of land and additions on the property. | Land | Improvement |
|---|---|---|---|---|
| 2024 | $3,667 | $85,420 | $14,000 | $71,420 |
| 2023 | $3,710 | $85,420 | $14,000 | $71,420 |
| 2022 | $4,046 | $81,010 | $11,550 | $69,460 |
| 2021 | $4,095 | $81,010 | $11,550 | $69,460 |
| 2020 | $4,113 | $81,010 | $11,550 | $69,460 |
| 2019 | $3,078 | $61,370 | $8,750 | $52,620 |
| 2018 | $3,036 | $61,370 | $8,750 | $52,620 |
| 2017 | $3,019 | $61,370 | $8,750 | $52,620 |
| 2016 | $3,004 | $59,530 | $10,500 | $49,030 |
| 2015 | $2,950 | $59,530 | $10,500 | $49,030 |
| 2014 | $2,983 | $59,530 | $10,500 | $49,030 |
| 2013 | $2,957 | $59,530 | $10,500 | $49,030 |
Source: Public Records
Map
Nearby Homes
- 1482 Lake Front Blvd
- 1190 Calla Rd W
- 0 Sharrott Rd Unit 5174987
- 400 Calla Rd W
- 1 W Calla Rd
- 9264 Sharrott Rd Unit 1803
- 9264 Sharrott Rd Unit 1001
- 9264 Sharrott Rd Unit 104
- 9264 Sharrott Rd Unit 1002
- 11200 Market St
- 11216 Market St
- 9144 Sharrott Rd
- 9140 Woodworth Rd
- 1242 W Western Reserve Rd
- 0 W Western Reserve Rd Unit 5146459
- 50 Carter Cir
- Lot 36 Berklee Dr
- 363 Maple Dr
- 331 Warren Ave
- 11541 South Ave
- 1001 Shovler Ct
- 1009 Shovler Ct Unit 1009
- 1009 Shoveler Ct
- 1004 Shovler Ct Unit 1004
- 2 Lake Front Blvd
- 1 Lake Front Blvd
- 1008 Shovler Ct Unit 1008
- 1008 Shoveler Ct
- 1000 Shovler Ct Unit 1000
- 42 Mallard Ln
- 1000 Shoveler Ct
- 57 Mallard Ln
- 1801 Mallard Ln
- 56 Mallard Ln
- 50 Mallard Ln
- 46 Mallard Ln
- 1107 Drake View Ct
- 1000 Mallard Ln
- VL Lake Front Blvd
- 1800 Mallard Ln Unit 1800