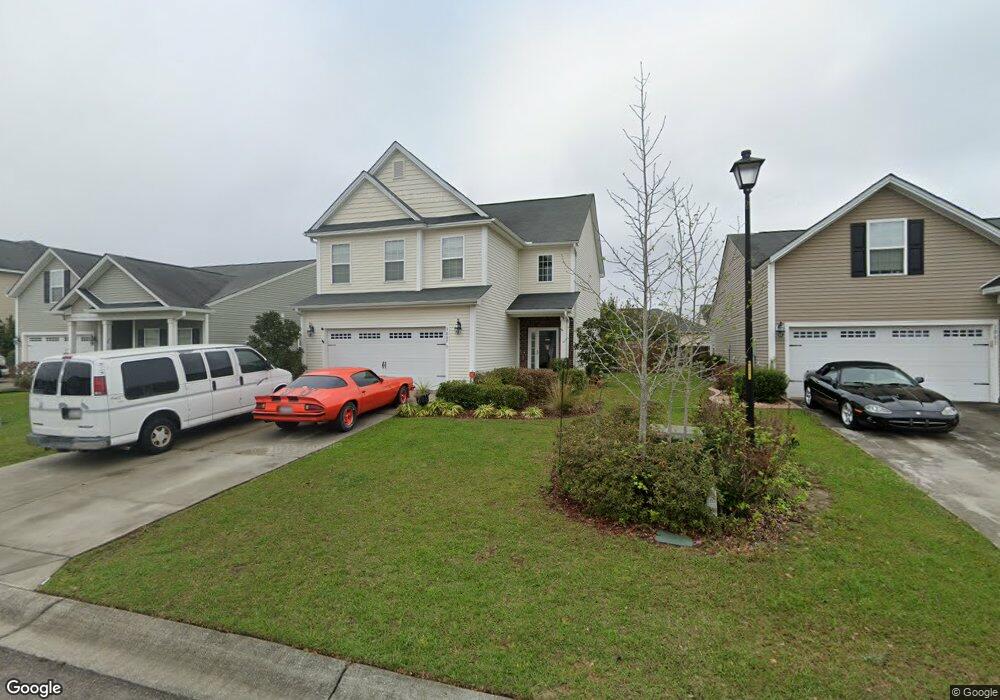
1005 Turtle Dove Ln Ladson, SC 29456
Estimated Value: $360,728 - $384,000
3
Beds
3
Baths
2,200
Sq Ft
$168/Sq Ft
Est. Value
About This Home
This home is located at 1005 Turtle Dove Ln, Ladson, SC 29456 and is currently estimated at $370,682, approximately $168 per square foot. 1005 Turtle Dove Ln is a home located in Berkeley County with nearby schools including Sangaree Elementary School, Sangaree Intermediate School, and Sangaree Middle School.
Ownership History
Date
Name
Owned For
Owner Type
Purchase Details
Closed on
Apr 30, 2013
Sold by
Stone Janet L
Bought by
American Homes 4 Rent Properties Three L
Current Estimated Value
Purchase Details
Closed on
Nov 11, 2010
Sold by
Stone Jo An L
Bought by
Stone Janet L
Home Financials for this Owner
Home Financials are based on the most recent Mortgage that was taken out on this home.
Original Mortgage
$148,773
Interest Rate
4.3%
Mortgage Type
FHA
Purchase Details
Closed on
Mar 9, 2010
Sold by
Lennar Carolinas Llc
Bought by
Stone Janet L and Stone Jo An L
Home Financials for this Owner
Home Financials are based on the most recent Mortgage that was taken out on this home.
Original Mortgage
$142,439
Interest Rate
4.97%
Mortgage Type
FHA
Purchase Details
Closed on
Dec 2, 2009
Sold by
Tamsberg Brothers Llc
Bought by
Lennar Carolinas Llc
Create a Home Valuation Report for This Property
The Home Valuation Report is an in-depth analysis detailing your home's value as well as a comparison with similar homes in the area
Home Values in the Area
Average Home Value in this Area
Purchase History
| Date | Buyer | Sale Price | Title Company |
|---|---|---|---|
| American Homes 4 Rent Properties Three L | $156,000 | -- | |
| Stone Janet L | -- | -- | |
| Stone Janet L | $164,990 | -- | |
| Lennar Carolinas Llc | $456,000 | -- |
Source: Public Records
Mortgage History
| Date | Status | Borrower | Loan Amount |
|---|---|---|---|
| Previous Owner | Stone Janet L | $148,773 | |
| Previous Owner | Stone Janet L | $142,439 |
Source: Public Records
Tax History
| Year | Tax Paid | Tax Assessment Tax Assessment Total Assessment is a certain percentage of the fair market value that is determined by local assessors to be the total taxable value of land and additions on the property. | Land | Improvement |
|---|---|---|---|---|
| 2025 | $3,149 | $201,814 | $35,997 | $165,817 |
| 2024 | $3,105 | $12,109 | $2,160 | $9,949 |
| 2023 | $3,105 | $12,109 | $2,160 | $9,949 |
| 2022 | $2,986 | $10,530 | $2,217 | $8,313 |
| 2021 | $3,008 | $10,530 | $2,217 | $8,313 |
| 2020 | $3,020 | $10,530 | $2,217 | $8,313 |
| 2019 | $3,013 | $10,530 | $2,217 | $8,313 |
| 2018 | $2,814 | $9,156 | $2,100 | $7,056 |
| 2017 | $2,714 | $9,156 | $2,100 | $7,056 |
| 2016 | $2,739 | $9,160 | $2,100 | $7,060 |
| 2015 | $2,610 | $9,160 | $2,100 | $7,060 |
| 2014 | $2,442 | $9,160 | $2,100 | $7,060 |
| 2013 | -- | $9,160 | $2,100 | $7,060 |
Source: Public Records
Map
Nearby Homes
- 2003 Wishing Well Trail
- 2062 Clipstone Dr
- 1401 Dahoo Ln
- 2014 Hunters Bend Trail
- 1059 Friartuck Trail
- 3033 Kinswood Ln
- 3032 Adventure Way
- 2010 Cripplecreek Dr
- 1070 Briar Rose Ln
- 803 Eastern White Pines Rd
- 1349 Hermitage Ln
- 104 Belmont Ct
- 807 Eastern White Pines Rd
- 4042 Exploration Rd
- 408 Bristlecone Dr
- 303 Houston Dr
- 1311 Shore Pine Dr
- 403 Bristlecone Dr
- 1303 Sand Pine Rd
- 1303 Discovery Dr
- 1003 Turtle Dove Ln
- 1007 Turtle Dove Ln
- 1009 Turtle Dove Ln
- 1208 Briar Rose Ln
- 1210 Briar Rose Ln
- 1001 Turtle Dove Ln
- 1212 Briar Rose Ln
- 1206 Briar Rose Ln
- 1011 Turtle Dove Ln
- 1004 Turtle Dove Ln
- 1006 Turtle Dove Ln
- 1214 Briar Rose Ln
- 1008 Turtle Dove Ln
- 1002 Turtle Dove Ln
- 1204 Briar Rose Ln
- 1013 Turtle Dove Ln
- 1010 Turtle Dove Ln
- 1216 Briar Rose Ln
- 1012 Turtle Dove Ln
- 1015 Turtle Dove Ln
Your Personal Tour Guide
Ask me questions while you tour the home.