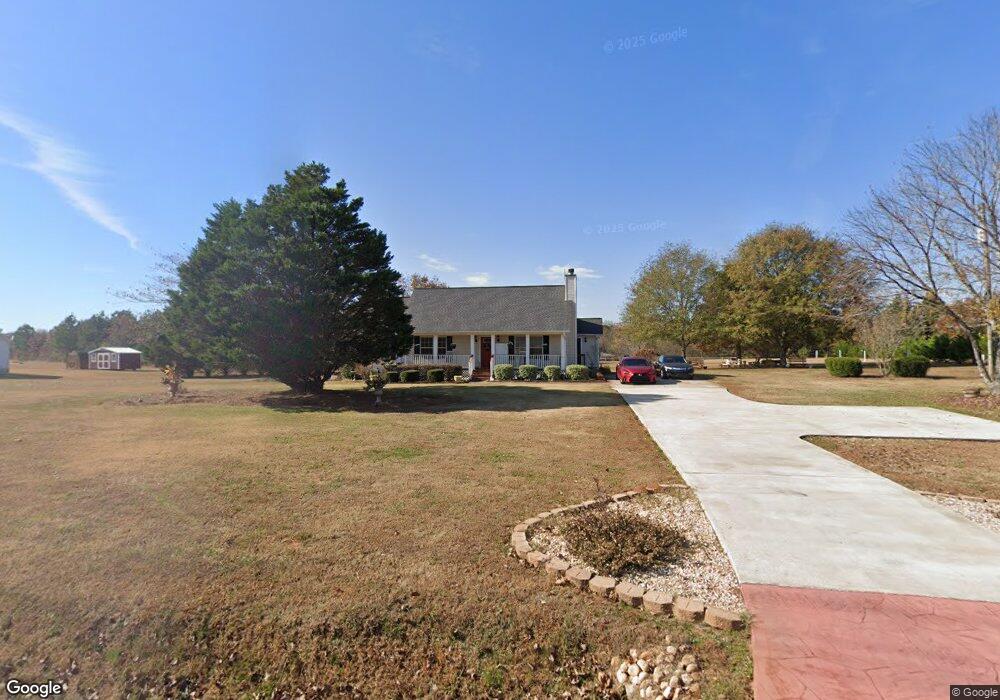
1005 Twin Oaks Rd Williamson, GA 30292
Estimated Value: $266,454 - $277,000
Studio
1
Bath
1,310
Sq Ft
$207/Sq Ft
Est. Value
About This Home
This home is located at 1005 Twin Oaks Rd, Williamson, GA 30292 and is currently estimated at $271,364, approximately $207 per square foot. 1005 Twin Oaks Rd is a home located in Pike County with nearby schools including Pike County Primary School, Pike County Elementary School, and Pike County Middle School.
Ownership History
Date
Name
Owned For
Owner Type
Purchase Details
Closed on
May 11, 2011
Sold by
Beckham Nedra
Bought by
York Nedra
Current Estimated Value
Purchase Details
Closed on
May 2, 2011
Sold by
Beckham Nedra
Bought by
York Nedra
Purchase Details
Closed on
Nov 30, 2006
Sold by
Wells Fargo Bank
Bought by
Beckham Nedra
Home Financials for this Owner
Home Financials are based on the most recent Mortgage that was taken out on this home.
Original Mortgage
$115,965
Interest Rate
6.29%
Mortgage Type
New Conventional
Purchase Details
Closed on
Oct 3, 2006
Sold by
Russell Robert D
Bought by
Wells Fargo Bank Na
Home Financials for this Owner
Home Financials are based on the most recent Mortgage that was taken out on this home.
Original Mortgage
$115,965
Interest Rate
6.29%
Mortgage Type
New Conventional
Purchase Details
Closed on
Oct 31, 2000
Sold by
Griffin Remodeling Inc
Bought by
Russell Robert D
Purchase Details
Closed on
Dec 7, 1999
Sold by
Evans J F
Bought by
Griffin Remodeling Inc
Create a Home Valuation Report for This Property
The Home Valuation Report is an in-depth analysis detailing your home's value as well as a comparison with similar homes in the area
Purchase History
| Date | Buyer | Sale Price | Title Company |
|---|---|---|---|
| York Nedra | $116,000 | -- | |
| York Nedra | $116,000 | -- | |
| Beckham Nedra | $116,000 | -- | |
| Wells Fargo Bank Na | -- | -- | |
| Russell Robert D | $98,000 | -- | |
| Griffin Remodeling Inc | -- | -- |
Source: Public Records
Mortgage History
| Date | Status | Borrower | Loan Amount |
|---|---|---|---|
| Previous Owner | Beckham Nedra | $115,965 |
Source: Public Records
Tax History
| Year | Tax Paid | Tax Assessment Tax Assessment Total Assessment is a certain percentage of the fair market value that is determined by local assessors to be the total taxable value of land and additions on the property. | Land | Improvement |
|---|---|---|---|---|
| 2025 | $1,847 | $78,986 | $18,160 | $60,826 |
| 2024 | $1,706 | $70,773 | $14,487 | $56,286 |
| 2023 | $1,998 | $70,773 | $14,487 | $56,286 |
| 2022 | $1,483 | $53,008 | $14,487 | $38,521 |
| 2021 | $1,298 | $45,129 | $6,608 | $38,521 |
| 2020 | $1,313 | $45,129 | $6,608 | $38,521 |
| 2019 | $1,196 | $36,553 | $6,608 | $29,945 |
| 2018 | $1,197 | $36,553 | $6,608 | $29,945 |
| 2017 | $1,188 | $36,553 | $6,608 | $29,945 |
| 2016 | $1,102 | $36,553 | $6,608 | $29,945 |
| 2015 | $1,048 | $36,553 | $6,608 | $29,945 |
| 2014 | $1,064 | $36,553 | $6,608 | $29,945 |
| 2013 | -- | $34,109 | $6,608 | $27,501 |
Source: Public Records
Map
Nearby Homes
- 733 Twin Oaks Rd
- 766 Drew Allen Rd
- 291 Millie Tr
- 1501 Williamson Zebulon Rd
- 32 Millie Tr
- A-1 Reidsboro Rd
- 15461 Concord St
- 0 US Highway 19 Unit 10664714
- 171 Jackson St
- 64 Pine St
- 16156 Barnesville St
- 203 Pine St
- 308 Wrightsburg Way
- 123 Griffin St
- 244 Wrightsburg Way
- 106 Wrightsburg Way
- 54 Melville Brown Rd
- 100 Melville Brown Rd
- 982 Traveler Ln Unit 49
- 160 Melville Brown Rd
- 953 Twin Oaks Rd
- 1051 Twin Oaks Rd
- 984 Twin Oaks Rd Unit 7
- 915 Twin Oaks Rd
- 1365 Drew Allen Rd Unit 6
- 1483 Drew Allen Rd
- 877 Twin Oaks Rd
- 1511 Drew Allen Rd
- 920 Twin Oaks Rd
- 1126 Twin Oaks Rd
- 1126 Twin Oaks Rd Unit 4.27 ACRES
- 891 Twin Oaks Rd
- 1187 Drew Allen Rd
- 1187 Drew Allen Rd Unit 5
- 1187 Drew Allen Rd Unit 9
- 1187 Drew Allen Rd Unit 8
- 1187 Drew Allen Rd Unit 7
- 1187 Drew Allen Rd Unit 6
- 0 Drew Allen Rd Unit 2950479
- 0 Drew Allen Rd Unit 3286595
Your Personal Tour Guide
Ask me questions while you tour the home.