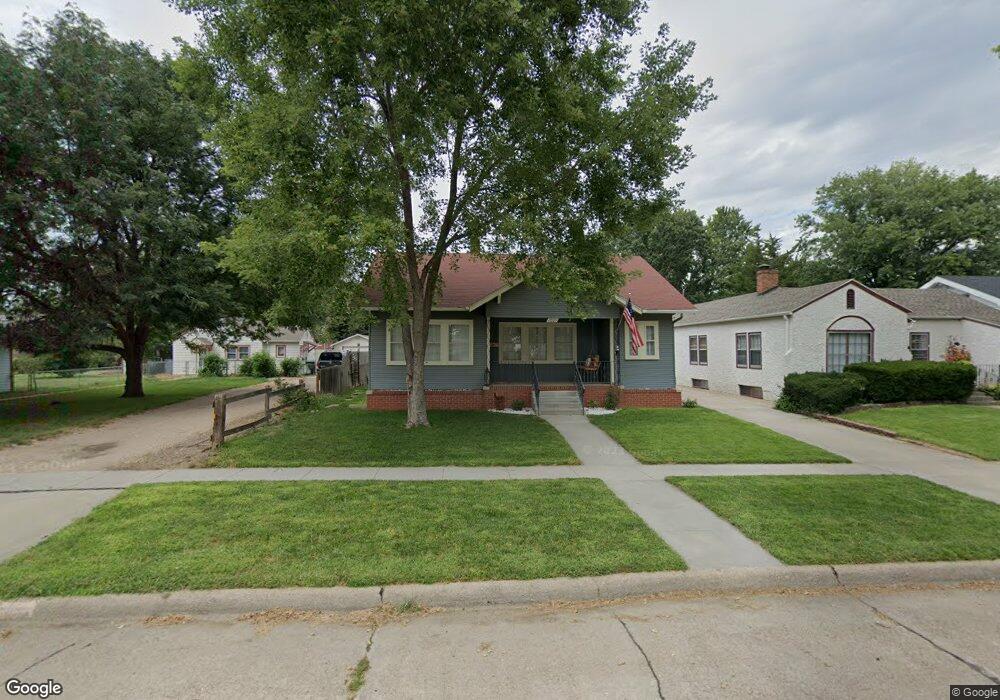
1005 W 21st St Kearney, NE 68845
Estimated Value: $170,000 - $218,889
2
Beds
2
Baths
900
Sq Ft
$213/Sq Ft
Est. Value
About This Home
This home is located at 1005 W 21st St, Kearney, NE 68845 and is currently estimated at $191,722, approximately $213 per square foot. 1005 W 21st St is a home located in Buffalo County with nearby schools including Central Elementary School, Horizon Middle School, and Kearney Senior High School.
Ownership History
Date
Name
Owned For
Owner Type
Purchase Details
Closed on
Jun 25, 2021
Sold by
Pycha Joshua D and Pycha Richard Brieana
Bought by
Pycha Joshua D
Current Estimated Value
Home Financials for this Owner
Home Financials are based on the most recent Mortgage that was taken out on this home.
Original Mortgage
$115,995
Outstanding Balance
$105,440
Interest Rate
3.02%
Estimated Equity
$86,282
Purchase Details
Closed on
Sep 10, 2018
Sold by
Price Robert I and Price Linda L
Bought by
Pycha Joshua D and Pycha Brieana M
Home Financials for this Owner
Home Financials are based on the most recent Mortgage that was taken out on this home.
Original Mortgage
$82,450
Interest Rate
4.5%
Mortgage Type
New Conventional
Purchase Details
Closed on
Jul 26, 2004
Sold by
Gray Randall W and Gray Ulrike A
Bought by
Davison Larry L
Create a Home Valuation Report for This Property
The Home Valuation Report is an in-depth analysis detailing your home's value as well as a comparison with similar homes in the area
Home Values in the Area
Average Home Value in this Area
Purchase History
| Date | Buyer | Sale Price | Title Company |
|---|---|---|---|
| Pycha Joshua D | -- | None Available | |
| Pycha Joshua D | $85,000 | None Available | |
| Davison Larry L | -- | None Available |
Source: Public Records
Mortgage History
| Date | Status | Borrower | Loan Amount |
|---|---|---|---|
| Open | Pycha Joshua D | $115,995 | |
| Previous Owner | Pycha Joshua D | $82,450 |
Source: Public Records
Tax History Compared to Growth
Tax History
| Year | Tax Paid | Tax Assessment Tax Assessment Total Assessment is a certain percentage of the fair market value that is determined by local assessors to be the total taxable value of land and additions on the property. | Land | Improvement |
|---|---|---|---|---|
| 2025 | $2,171 | $169,830 | $34,320 | $135,510 |
| 2024 | $2,171 | $162,955 | $33,320 | $129,635 |
| 2023 | $2,525 | $148,360 | $33,320 | $115,040 |
| 2022 | $2,325 | $132,505 | $31,250 | $101,255 |
| 2021 | $2,207 | $127,965 | $32,625 | $95,340 |
| 2020 | $2,189 | $126,555 | $32,625 | $93,930 |
| 2019 | $2,374 | $135,610 | $32,625 | $102,985 |
| 2018 | $1,879 | $108,865 | $32,625 | $76,240 |
| 2017 | $1,865 | $108,780 | $32,625 | $76,155 |
| 2016 | $1,850 | $108,780 | $32,625 | $76,155 |
| 2015 | $1,379 | $96,740 | $0 | $0 |
| 2014 | $1,379 | $72,340 | $0 | $0 |
Source: Public Records
Map
Nearby Homes