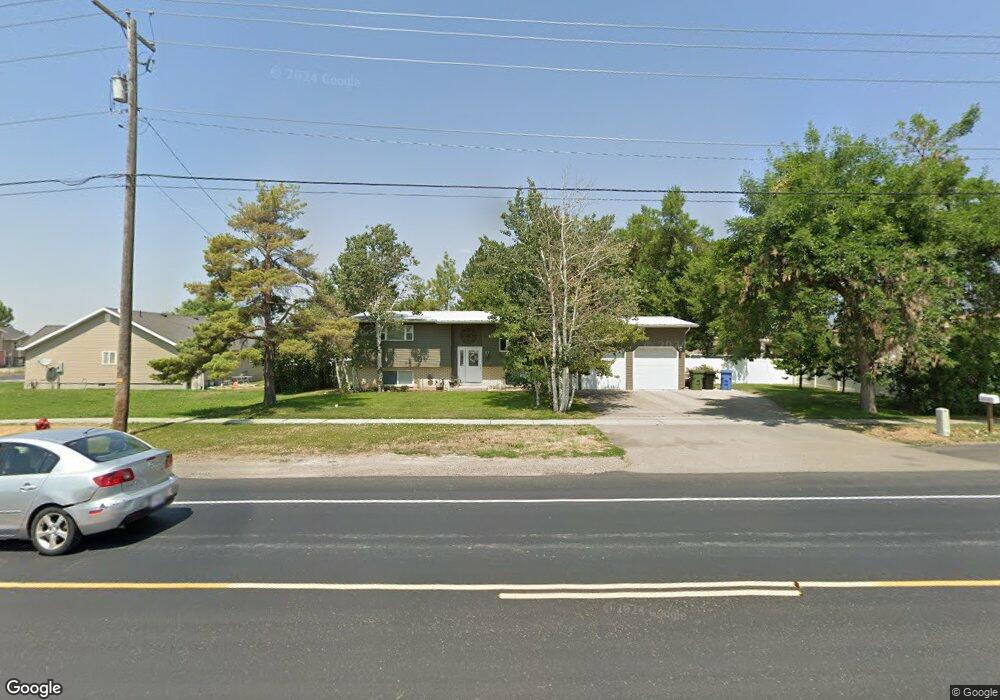
1005 W 3200 S Nibley, UT 84321
Estimated Value: $436,000 - $523,000
4
Beds
3
Baths
2,960
Sq Ft
$165/Sq Ft
Est. Value
About This Home
This home is located at 1005 W 3200 S, Nibley, UT 84321 and is currently estimated at $488,655, approximately $165 per square foot. 1005 W 3200 S is a home located in Cache County with nearby schools including Heritage School, South Cache Middle School, and Spring Creek Middle School.
Ownership History
Date
Name
Owned For
Owner Type
Purchase Details
Closed on
May 20, 2025
Sold by
Gordon Kyle and Gordon Cami
Bought by
Kyle And Cami Gordon Family Trust and Gordon
Current Estimated Value
Purchase Details
Closed on
Aug 10, 2022
Sold by
Shawn Gooch
Bought by
Gordon Kyle and Gordon Cami
Home Financials for this Owner
Home Financials are based on the most recent Mortgage that was taken out on this home.
Original Mortgage
$522,500
Interest Rate
5.51%
Mortgage Type
New Conventional
Purchase Details
Closed on
May 13, 2013
Sold by
Maughan Lucy
Bought by
Gooch Shawn and Gooch Shannon
Home Financials for this Owner
Home Financials are based on the most recent Mortgage that was taken out on this home.
Original Mortgage
$140,000
Interest Rate
3.5%
Mortgage Type
New Conventional
Purchase Details
Closed on
Apr 18, 2007
Sold by
Maughan Lucy
Bought by
Maughan Lucy
Create a Home Valuation Report for This Property
The Home Valuation Report is an in-depth analysis detailing your home's value as well as a comparison with similar homes in the area
Home Values in the Area
Average Home Value in this Area
Purchase History
| Date | Buyer | Sale Price | Title Company |
|---|---|---|---|
| Kyle And Cami Gordon Family Trust | -- | None Listed On Document | |
| Gordon Kyle | -- | Amicus Title | |
| Gooch Shawn | -- | Cache Title Logan | |
| Maughan Lucy | -- | None Available |
Source: Public Records
Mortgage History
| Date | Status | Borrower | Loan Amount |
|---|---|---|---|
| Previous Owner | Gordon Kyle | $522,500 | |
| Previous Owner | Gooch Shawn | $140,000 |
Source: Public Records
Tax History Compared to Growth
Tax History
| Year | Tax Paid | Tax Assessment Tax Assessment Total Assessment is a certain percentage of the fair market value that is determined by local assessors to be the total taxable value of land and additions on the property. | Land | Improvement |
|---|---|---|---|---|
| 2025 | $1,622 | $215,060 | $0 | $0 |
| 2024 | $1,720 | $214,125 | $0 | $0 |
| 2023 | $1,817 | $211,725 | $0 | $0 |
| 2022 | $1,891 | $211,725 | $0 | $0 |
| 2021 | $1,789 | $311,120 | $65,000 | $246,120 |
| 2020 | $1,632 | $270,100 | $65,000 | $205,100 |
| 2019 | $1,541 | $243,151 | $65,000 | $178,151 |
| 2018 | $1,266 | $194,976 | $44,000 | $150,976 |
| 2017 | $1,206 | $98,340 | $0 | $0 |
| 2016 | $1,219 | $98,340 | $0 | $0 |
| 2015 | $1,211 | $98,340 | $0 | $0 |
| 2014 | $976 | $81,115 | $0 | $0 |
| 2013 | -- | $83,520 | $0 | $0 |
Source: Public Records
Map
Nearby Homes
- 3369 1010 W
- 907 W 2980 S
- 1008 W 3410 S
- 1004 3410 S
- 2814 S 1150 W
- 3074 S 800 W
- 1288 W 3440 S
- 2938 S 600 W
- 3261 S 1500 W
- 2616 S 900 W
- 3262 S 470 W
- 268 W 3400 S Unit 5
- 3241 S 1600 W
- 400 W 3085 S
- 2680 S 600 W
- 2615 S 600 W
- 374 Ropelato Dr
- 2485 S 1296 W
- Lyndhurst Plan at Ridgeline Park - Nibley (Active Adult)
- Blackberry Plan at Ridgeline Park - Nibley
- 3162 S 1000 W Unit 75
- 3162 S 1000 W
- 3146 S 1000 W Unit 76
- 3146 S 1000 W
- 3130 S 1000 W
- 3130 S 1000 W Unit 77
- 640 W 3200 S
- 550 W 3200 S
- 3114 S 1000 W Unit 78
- 3114 S 1000 W
- 3145 S 1000 W
- 3131 S 1000 W
- 1049 W 3200 S
- 3098 S 1000 W
- 3098 S 1000 W Unit 79
- 3115 S 1000 W
- 3099 S 1000 W
- 1100 W 3200 S
- 3084 S 1000 W Unit 80
- 3084 S 1000 W