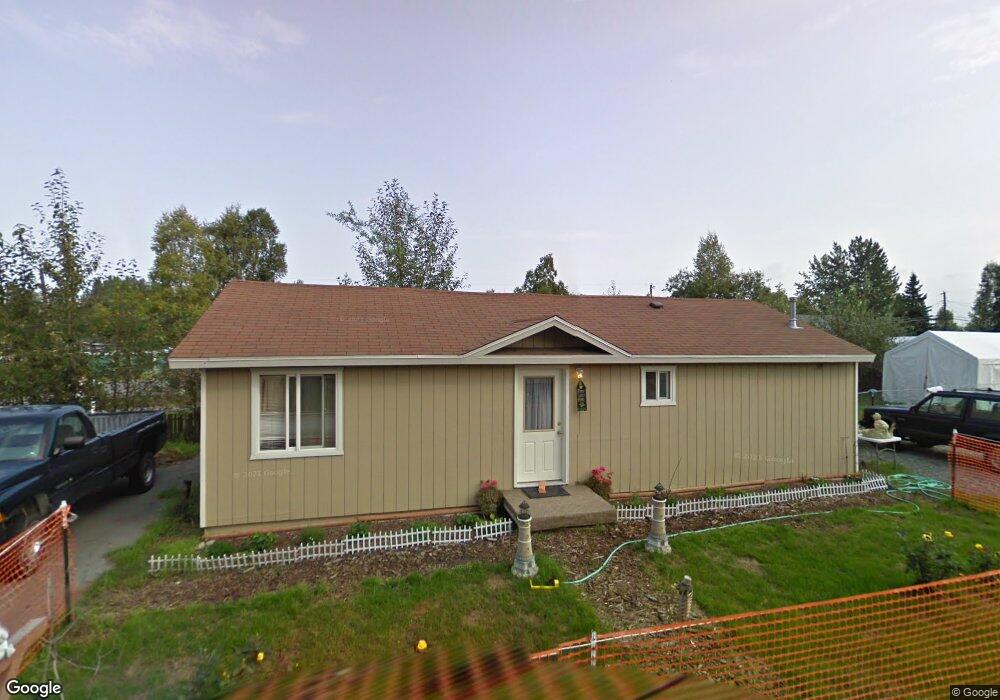
1005 W 39th Ave Anchorage, AK 99503
Spenard NeighborhoodEstimated Value: $207,000 - $273,795
3
Beds
1
Bath
840
Sq Ft
$278/Sq Ft
Est. Value
About This Home
This home is located at 1005 W 39th Ave, Anchorage, AK 99503 and is currently estimated at $233,932, approximately $278 per square foot. 1005 W 39th Ave is a home located in Anchorage Municipality with nearby schools including Willow Crest Elementary School, Romig Middle School, and West High School.
Ownership History
Date
Name
Owned For
Owner Type
Purchase Details
Closed on
Feb 14, 2008
Sold by
Hud
Bought by
Spangler Ray Alan
Current Estimated Value
Purchase Details
Closed on
Oct 4, 2007
Sold by
Alaska Housing Finance Corp
Bought by
Hud
Purchase Details
Closed on
Sep 27, 2007
Sold by
Fegert Tilka
Bought by
Alaska Housing Finance Corp
Purchase Details
Closed on
Jun 30, 2005
Sold by
Cook Inlet Housing Authority
Bought by
Fegert Tilka
Home Financials for this Owner
Home Financials are based on the most recent Mortgage that was taken out on this home.
Original Mortgage
$142,375
Interest Rate
5.65%
Mortgage Type
FHA
Purchase Details
Closed on
Jan 20, 2005
Sold by
Sagmoen Louise
Bought by
Cook Inlet Housing Authority
Create a Home Valuation Report for This Property
The Home Valuation Report is an in-depth analysis detailing your home's value as well as a comparison with similar homes in the area
Home Values in the Area
Average Home Value in this Area
Purchase History
| Date | Buyer | Sale Price | Title Company |
|---|---|---|---|
| Spangler Ray Alan | -- | None Available | |
| Hud | -- | None Available | |
| Alaska Housing Finance Corp | $149,656 | None Available | |
| Fegert Tilka | -- | -- | |
| Cook Inlet Housing Authority | $97,000 | -- |
Source: Public Records
Mortgage History
| Date | Status | Borrower | Loan Amount |
|---|---|---|---|
| Previous Owner | Fegert Tilka | $142,375 |
Source: Public Records
Tax History
| Year | Tax Paid | Tax Assessment Tax Assessment Total Assessment is a certain percentage of the fair market value that is determined by local assessors to be the total taxable value of land and additions on the property. | Land | Improvement |
|---|---|---|---|---|
| 2025 | -- | $221,200 | $84,400 | $136,800 |
| 2024 | -- | $213,000 | $84,400 | $128,600 |
| 2023 | $3,375 | $198,200 | $84,400 | $113,800 |
| 2022 | $145 | $198,300 | $84,500 | $113,800 |
| 2021 | $3,154 | $175,000 | $84,500 | $90,500 |
| 2020 | $3,060 | $180,000 | $84,500 | $95,500 |
| 2019 | $2,290 | $175,000 | $84,500 | $90,500 |
| 2018 | $2,699 | $164,600 | $73,400 | $91,200 |
| 2017 | $2,753 | $175,800 | $73,400 | $102,400 |
| 2016 | $2,269 | $171,400 | $69,600 | $101,800 |
| 2015 | $2,269 | $170,500 | $69,600 | $100,900 |
| 2014 | $2,269 | $158,700 | $69,600 | $89,100 |
Source: Public Records
Map
Nearby Homes
- 4004 Cope St
- 4113 Cope St
- 4101 N North Star St
- 4106 N Star St
- 4207 Cope St
- 3400 Indiana St
- 3901 Hayes St
- 910 W 36th Ave
- 300 W Tudor Rd
- 3405 Dorbrandt St
- 3400 N Star St
- 4300 Hayes St
- 4306 Hayes St
- 3507 Greenland Dr
- 3201 Spenard Rd
- 000 Anchorage
- 4101 Credit Union Dr
- 3605 Oregon Dr Unit 4
- 3315 Monticello Ct Unit 8E
- 3406 Wyoming Dr
- 3807 Cope St
- 1006 W 39th Ave
- 3805 Cope St
- 3903 Cope St
- 1004 W 39th Ave
- 1003 W 39th Ave
- 3804 Cope St
- 1002 W 39th Ave
- 1008 Chugach Way
- 3902 Cope St
- 1010 Chugach Way
- 3802 Cope St
- 1006 Chugach Way
- 1000 W 39th Ave
- 1002 Chugach Way
- 3808 Cope St
- 1001 W 39th Ave
- 1000 Chugach Way
- 3909 Cope St
- 1007 W 40th Ave
Your Personal Tour Guide
Ask me questions while you tour the home.