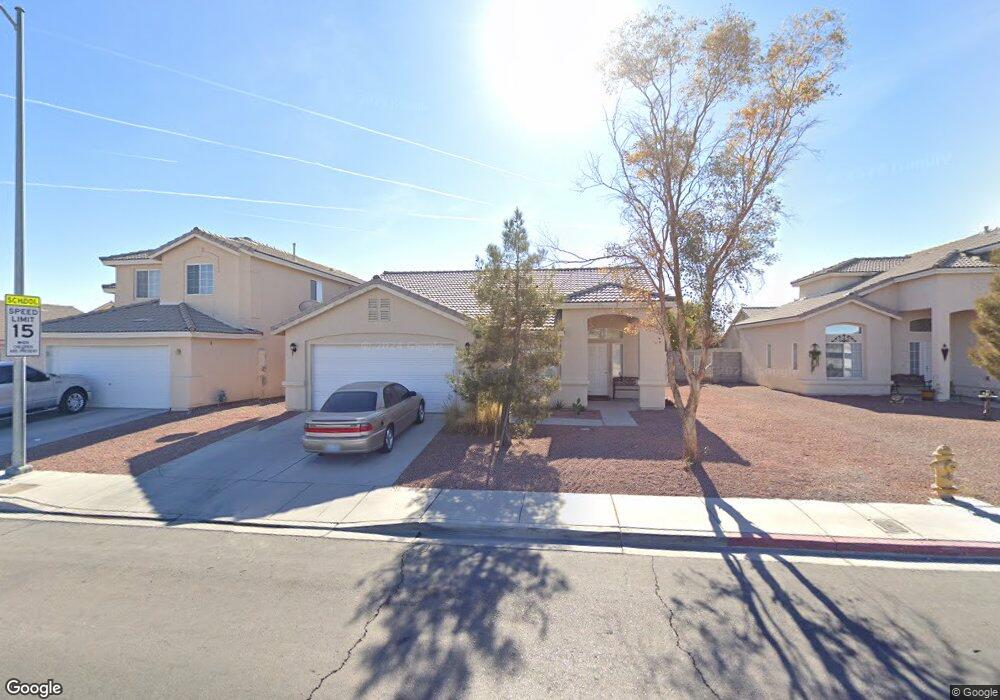
1005 W Cartier Ave Unit 2 North Las Vegas, NV 89030
Downtown North Las Vegas NeighborhoodEstimated Value: $363,000 - $389,000
3
Beds
2
Baths
1,473
Sq Ft
$253/Sq Ft
Est. Value
About This Home
This home is located at 1005 W Cartier Ave Unit 2, North Las Vegas, NV 89030 and is currently estimated at $371,994, approximately $252 per square foot. 1005 W Cartier Ave Unit 2 is a home located in Clark County with nearby schools including H.P. Fitzgerald Elementary School, West Prepatory Academy At Charlles I West Hall Sec, and Cheyenne High School.
Ownership History
Date
Name
Owned For
Owner Type
Purchase Details
Closed on
Feb 4, 2019
Sold by
Bkd Equity Llc
Bought by
Bkd Rent Llc
Current Estimated Value
Home Financials for this Owner
Home Financials are based on the most recent Mortgage that was taken out on this home.
Original Mortgage
$11,071
Outstanding Balance
$9,733
Interest Rate
4.5%
Mortgage Type
Commercial
Estimated Equity
$362,261
Purchase Details
Closed on
May 5, 2011
Sold by
Yu Su Ya
Bought by
Bkb Capital Llc
Purchase Details
Closed on
Jun 30, 2004
Sold by
Estella Saura M
Bought by
Yu Suya
Home Financials for this Owner
Home Financials are based on the most recent Mortgage that was taken out on this home.
Original Mortgage
$172,400
Interest Rate
1.25%
Mortgage Type
Negative Amortization
Purchase Details
Closed on
Aug 5, 2003
Sold by
Carey Avenue Llc
Bought by
Estella Saura M
Home Financials for this Owner
Home Financials are based on the most recent Mortgage that was taken out on this home.
Original Mortgage
$142,658
Interest Rate
5.17%
Mortgage Type
FHA
Create a Home Valuation Report for This Property
The Home Valuation Report is an in-depth analysis detailing your home's value as well as a comparison with similar homes in the area
Home Values in the Area
Average Home Value in this Area
Purchase History
| Date | Buyer | Sale Price | Title Company |
|---|---|---|---|
| Bkd Rent Llc | -- | Os National Llc | |
| Bkd Equity Llc | -- | Os National Llc Rq | |
| Bkb Capital Llc | $46,200 | National Title Company | |
| Yu Suya | $215,500 | Old Republic Title Co Of Ne | |
| Estella Saura M | $144,927 | Lawyers Title Of Nevada |
Source: Public Records
Mortgage History
| Date | Status | Borrower | Loan Amount |
|---|---|---|---|
| Open | Bkd Equity Llc | $11,071 | |
| Closed | Bkd Rent Llc | $11,071 | |
| Previous Owner | Yu Suya | $172,400 | |
| Previous Owner | Estella Saura M | $142,658 |
Source: Public Records
Tax History Compared to Growth
Tax History
| Year | Tax Paid | Tax Assessment Tax Assessment Total Assessment is a certain percentage of the fair market value that is determined by local assessors to be the total taxable value of land and additions on the property. | Land | Improvement |
|---|---|---|---|---|
| 2025 | $1,319 | $93,963 | $26,950 | $67,013 |
| 2024 | $1,222 | $93,963 | $26,950 | $67,013 |
| 2023 | $1,222 | $86,197 | $23,100 | $63,097 |
| 2022 | $1,132 | $78,584 | $21,000 | $57,584 |
| 2021 | $1,048 | $73,946 | $19,250 | $54,696 |
| 2020 | $970 | $73,463 | $19,250 | $54,213 |
| 2019 | $909 | $70,890 | $17,500 | $53,390 |
| 2018 | $868 | $60,837 | $14,700 | $46,137 |
| 2017 | $1,675 | $49,926 | $11,550 | $38,376 |
| 2016 | $823 | $47,356 | $7,000 | $40,356 |
| 2015 | $820 | $34,109 | $3,500 | $30,609 |
| 2014 | $795 | $24,476 | $3,500 | $20,976 |
Source: Public Records
Map
Nearby Homes
- 2539 Tuskegee St
- 2617 Star Manor St Unit II
- 2621 Rainbow Glow St
- 2419 Country Orchard St
- 2413 Copperbelt St
- 1116 Boylston Ave
- 1120 Boylston Ave
- 2408 Copperbelt St
- 1105 Boylston Ave
- 1108 Boylston Ave
- 1112 Boylston Ave
- 2409 Copperbelt St
- 2405 Copperbelt St
- 1217 Star Meadow Dr
- 00 Duquesne Ave
- 4 Duquesne Ave
- 2537 Page St
- 0 Windsor Ave Unit 2711938
- 0 Windsor Ave
- 704 Kings Ave
- 1001 W Cartier Ave
- 1009 W Cartier Ave
- 1009 W Cartier Ave Unit N
- 1006 Carey Grove Ave
- 1013 W Cartier Ave
- 1002 Carey Grove Ave
- 923 W Cartier Ave
- 1010 Carey Grove Ave
- 924 Carey Grove Ave Unit 2
- 919 W Cartier Ave
- 1017 W Cartier Ave
- 0 Concord St & Cartier Ave
- 920 Carey Grove Ave Unit 2
- 1014 Carey Grove Ave
- 1021 W Cartier Ave
- 1021 W Cartier Ave Unit non
- 915 W Cartier Ave
- 1005 Carey Grove Ave
- 1001 Carey Grove Ave
- 2531 Sidney Spring St