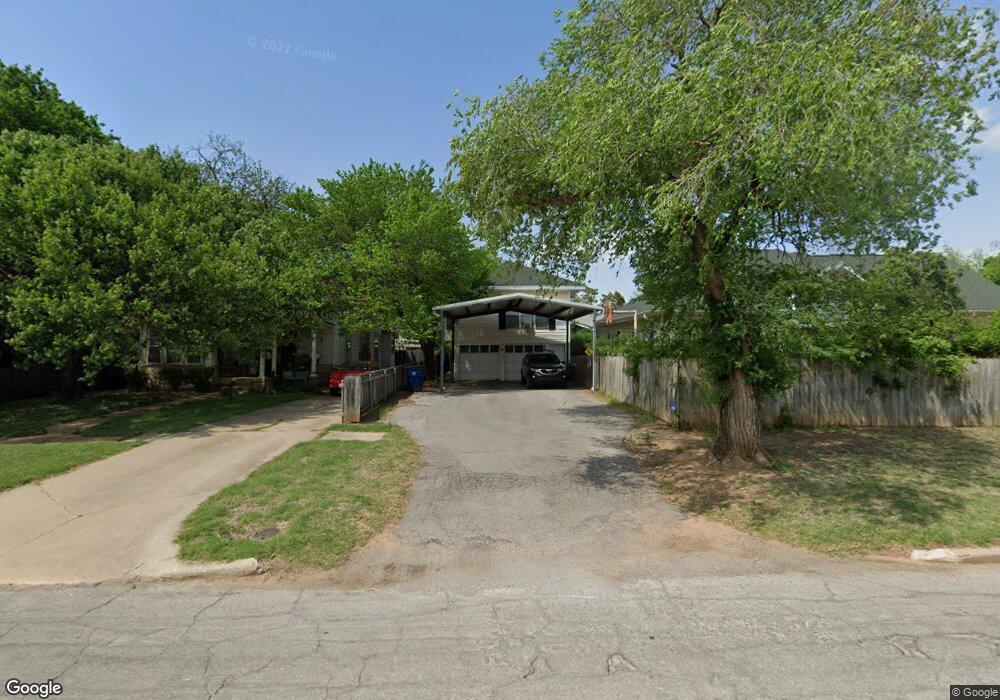
1005 W Hickory Ave Duncan, OK 73533
Estimated Value: $59,000 - $94,000
3
Beds
3
Baths
1,646
Sq Ft
$49/Sq Ft
Est. Value
About This Home
This home is located at 1005 W Hickory Ave, Duncan, OK 73533 and is currently estimated at $81,341, approximately $49 per square foot. 1005 W Hickory Ave is a home located in Stephens County with nearby schools including Emerson Elementary School, Duncan Middle School, and Duncan High School.
Ownership History
Date
Name
Owned For
Owner Type
Purchase Details
Closed on
Jul 27, 2022
Sold by
Gail Williams Tabatha
Bought by
Ivey Catherine
Current Estimated Value
Purchase Details
Closed on
Apr 2, 2018
Sold by
U S Bank Na
Bought by
Williams Tabatha Gail
Purchase Details
Closed on
Dec 29, 2015
Sold by
Potter Sandra G and Potter Russell B
Bought by
Farmer Logan D
Home Financials for this Owner
Home Financials are based on the most recent Mortgage that was taken out on this home.
Original Mortgage
$71,185
Interest Rate
3.98%
Mortgage Type
FHA
Purchase Details
Closed on
Nov 28, 2006
Sold by
Davis Angela S and Smith Angela S
Bought by
Gordon Laveda J and Alexander Sandra G
Purchase Details
Closed on
Sep 16, 2002
Sold by
Adams Rick L and Adams Sheri
Purchase Details
Closed on
Jun 19, 2000
Sold by
Rodriguez Rene and Rodriguez Debra
Purchase Details
Closed on
Apr 29, 1992
Sold by
Dean Leonard H
Create a Home Valuation Report for This Property
The Home Valuation Report is an in-depth analysis detailing your home's value as well as a comparison with similar homes in the area
Home Values in the Area
Average Home Value in this Area
Purchase History
| Date | Buyer | Sale Price | Title Company |
|---|---|---|---|
| Ivey Catherine | $59,000 | None Listed On Document | |
| Williams Tabatha Gail | $35,600 | Solidifi Title & Closing | |
| Farmer Logan D | $72,500 | Okf Title & Escrow Services | |
| Gordon Laveda J | $59,000 | None Available | |
| -- | $62,000 | -- | |
| -- | $50,500 | -- | |
| -- | $23,500 | -- |
Source: Public Records
Mortgage History
| Date | Status | Borrower | Loan Amount |
|---|---|---|---|
| Previous Owner | Farmer Logan D | $71,185 |
Source: Public Records
Tax History Compared to Growth
Tax History
| Year | Tax Paid | Tax Assessment Tax Assessment Total Assessment is a certain percentage of the fair market value that is determined by local assessors to be the total taxable value of land and additions on the property. | Land | Improvement |
|---|---|---|---|---|
| 2025 | $562 | $6,125 | $613 | $5,512 |
| 2024 | $562 | $6,566 | $613 | $5,953 |
| 2023 | $562 | $6,564 | $613 | $5,951 |
| 2022 | $666 | $8,105 | $613 | $7,492 |
| 2021 | $667 | $7,832 | $613 | $7,219 |
| 2020 | $613 | $7,104 | $613 | $6,491 |
| 2019 | $628 | $7,255 | $613 | $6,642 |
| 2018 | $747 | $8,383 | $613 | $7,770 |
| 2017 | $603 | $8,016 | $613 | $7,403 |
| 2016 | $600 | $8,053 | $613 | $7,440 |
| 2015 | $586 | $5,813 | $613 | $5,200 |
| 2014 | $586 | $6,592 | $550 | $6,042 |
Source: Public Records
Map
Nearby Homes
- 1105 W Beech Ave
- 1116 1116 W Chestnut
- 1213 W Pine Ave
- 810 810 N 12th St
- 1112 W Spruce St
- 1309 W Beech Ave
- 1001 1001 W Hackberry
- 815 N 14th St
- 1105 N Grand Blvd
- 1203 W Walnut Ave
- 1112 1112 N 12th
- 812 N 15th St
- 705 W Hackberry Ave
- 805 805 N 5th
- 1114 N 13th St
- 1202 N Grand Blvd
- 27 N 14th St
- 512 W Oak Ave
- 1444 N 8th St
- 312 W Beech Ave
- 1007 W Hickory Ave
- 1005 1005 W Hickory Ave
- 605 N 10th St
- 603 N 10th St
- 607 N 10th St
- 1009 W Hickory Ave
- 611 N 10th St
- 1013 W Hickory Ave
- 1004 W Pine Ave
- 1006 W Pine Ave
- 1013 1013 W Hickory
- 915 W Hickory Ave
- 511 N 10th St
- 608 N 10th St
- 1012 W Pine Ave
- 1015 W Hickory Ave
- 615 N 10th St
- 608 N 11th St
- 1008 W Hickory Ave
- 612 N 10th St