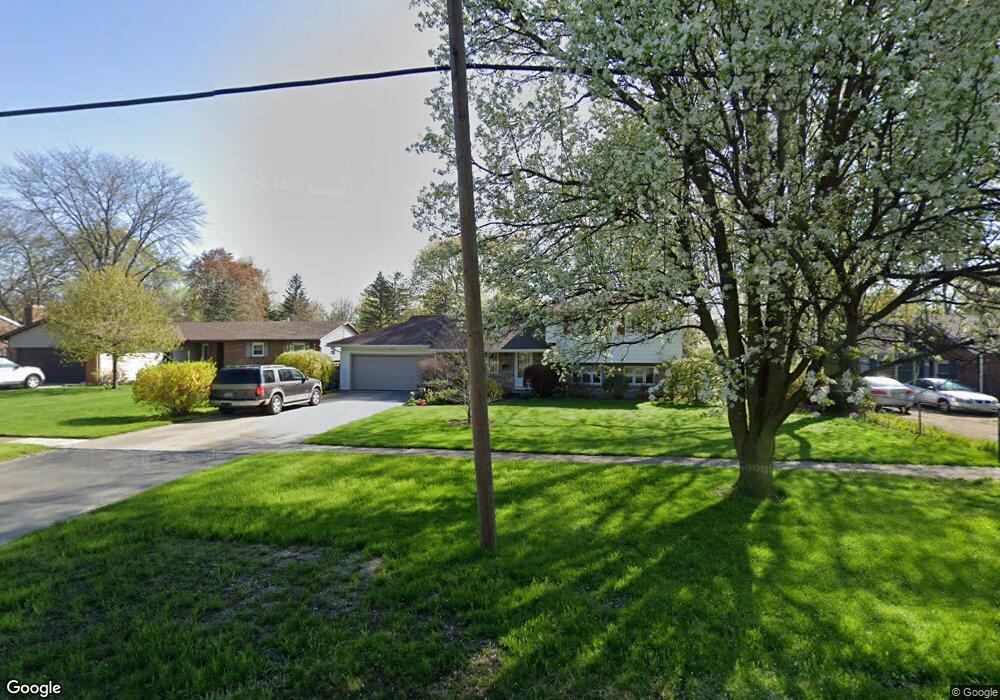
1005 Walnut St Perrysburg, OH 43551
Estimated Value: $229,000 - $304,000
3
Beds
2
Baths
1,836
Sq Ft
$150/Sq Ft
Est. Value
About This Home
This home is located at 1005 Walnut St, Perrysburg, OH 43551 and is currently estimated at $275,106, approximately $149 per square foot. 1005 Walnut St is a home located in Wood County with nearby schools including Frank Elementary School, Perrysburg Junior High School, and Perrysburg High School.
Ownership History
Date
Name
Owned For
Owner Type
Purchase Details
Closed on
Sep 13, 2011
Sold by
Matney Douglas C
Bought by
Matney Douglas C and Matney Suellyn
Current Estimated Value
Purchase Details
Closed on
Jul 9, 2004
Sold by
Sandusky Howard C
Bought by
Matney Douglas C
Home Financials for this Owner
Home Financials are based on the most recent Mortgage that was taken out on this home.
Original Mortgage
$118,000
Outstanding Balance
$57,128
Interest Rate
5.75%
Mortgage Type
Purchase Money Mortgage
Estimated Equity
$217,978
Purchase Details
Closed on
Nov 26, 2002
Sold by
Chen Q P Trustee
Bought by
Sandusky Howard C
Home Financials for this Owner
Home Financials are based on the most recent Mortgage that was taken out on this home.
Original Mortgage
$123,300
Interest Rate
6.22%
Purchase Details
Closed on
Jul 28, 2001
Sold by
Zhanhong Zhang
Bought by
Z & W Children Trust and Chen Q P
Purchase Details
Closed on
Sep 17, 1991
Bought by
Hoffman John L Le
Create a Home Valuation Report for This Property
The Home Valuation Report is an in-depth analysis detailing your home's value as well as a comparison with similar homes in the area
Home Values in the Area
Average Home Value in this Area
Purchase History
| Date | Buyer | Sale Price | Title Company |
|---|---|---|---|
| Matney Douglas C | -- | Attorney | |
| Matney Douglas C | $147,500 | Port Lawrence | |
| Sandusky Howard C | $137,000 | A.R.E.A. Title Agency Inc | |
| Z & W Children Trust | -- | -- | |
| Hoffman John L Le | -- | -- |
Source: Public Records
Mortgage History
| Date | Status | Borrower | Loan Amount |
|---|---|---|---|
| Open | Matney Douglas C | $118,000 | |
| Previous Owner | Sandusky Howard C | $123,300 |
Source: Public Records
Tax History Compared to Growth
Tax History
| Year | Tax Paid | Tax Assessment Tax Assessment Total Assessment is a certain percentage of the fair market value that is determined by local assessors to be the total taxable value of land and additions on the property. | Land | Improvement |
|---|---|---|---|---|
| 2024 | $4,669 | $80,465 | $16,730 | $63,735 |
| 2023 | $4,669 | $80,470 | $16,730 | $63,740 |
| 2021 | $4,003 | $63,460 | $14,490 | $48,970 |
| 2020 | $3,980 | $63,460 | $14,490 | $48,970 |
| 2019 | $3,533 | $54,640 | $14,490 | $40,150 |
| 2018 | $3,137 | $54,640 | $14,490 | $40,150 |
| 2017 | $1,508 | $54,640 | $14,490 | $40,150 |
| 2016 | $2,934 | $49,220 | $16,910 | $32,310 |
| 2015 | $2,934 | $49,220 | $16,910 | $32,310 |
| 2014 | $2,960 | $49,220 | $16,910 | $32,310 |
| 2013 | $3,027 | $49,220 | $16,910 | $32,310 |
Source: Public Records
Map
Nearby Homes
- 1016 Walnut St
- 872 Cherry St
- 1085 Birch Dr
- 204 W 8th St
- 865 Mulberry St
- 412 W South Boundary St
- 122 W 6th St
- 528 Elm St
- 135 Birchcrest Dr
- 525 Orchard St
- 208 E Indiana Ave
- 521 Loomis Dr
- 170 Edgewood Dr
- 333 Southwood Dr
- 251 Mallard Rd
- 11966 Eckel Junction Rd
- 277 Blue Jacket Rd
- 314 E 2nd St
- 884 Bexley Dr
- 622 Turnbury Ln Unit 622