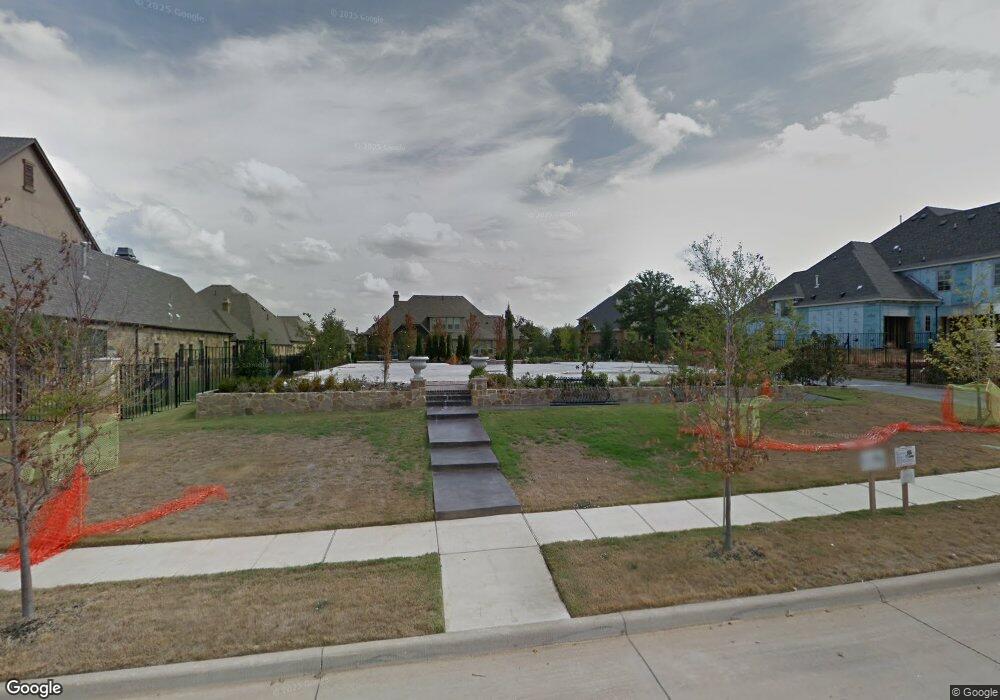
1005 Whittington Place Southlake, TX 76092
Estimated Value: $2,984,000 - $3,218,000
6
Beds
8
Baths
7,447
Sq Ft
$412/Sq Ft
Est. Value
About This Home
This home is located at 1005 Whittington Place, Southlake, TX 76092 and is currently estimated at $3,068,943, approximately $412 per square foot. 1005 Whittington Place is a home located in Tarrant County with nearby schools including Don T. Durham Intermediate School, Walnut Grove Elementary School, and Carroll Middle School.
Ownership History
Date
Name
Owned For
Owner Type
Purchase Details
Closed on
Dec 16, 2021
Sold by
Gada Ravi P
Bought by
Sunshine Living Trust
Current Estimated Value
Purchase Details
Closed on
Mar 27, 2018
Sold by
Ricjhards Tamniqua M and Ricjhards Shane
Bought by
Gada Ravi P and Gada Michelle M
Home Financials for this Owner
Home Financials are based on the most recent Mortgage that was taken out on this home.
Original Mortgage
$1,205,000
Interest Rate
4.38%
Mortgage Type
New Conventional
Purchase Details
Closed on
Jun 19, 2014
Sold by
Smith Ware Taniqua M
Bought by
Todd Bonneau Homes Llc
Purchase Details
Closed on
Jun 14, 2013
Sold by
Standard Pacific Of Texas Inc
Bought by
Smith Ware Taniqua M
Home Financials for this Owner
Home Financials are based on the most recent Mortgage that was taken out on this home.
Original Mortgage
$784,000
Interest Rate
3.38%
Mortgage Type
New Conventional
Create a Home Valuation Report for This Property
The Home Valuation Report is an in-depth analysis detailing your home's value as well as a comparison with similar homes in the area
Home Values in the Area
Average Home Value in this Area
Purchase History
| Date | Buyer | Sale Price | Title Company |
|---|---|---|---|
| Sunshine Living Trust | -- | None Listed On Document | |
| Sunshine Living Trust | -- | None Listed On Document | |
| Gada Ravi P | -- | Capital Title | |
| Todd Bonneau Homes Llc | -- | None Available | |
| Smith Ware Taniqua M | -- | None Available |
Source: Public Records
Mortgage History
| Date | Status | Borrower | Loan Amount |
|---|---|---|---|
| Previous Owner | Gada Ravi P | $1,205,000 | |
| Previous Owner | Smith Ware Taniqua M | $784,000 |
Source: Public Records
Tax History Compared to Growth
Tax History
| Year | Tax Paid | Tax Assessment Tax Assessment Total Assessment is a certain percentage of the fair market value that is determined by local assessors to be the total taxable value of land and additions on the property. | Land | Improvement |
|---|---|---|---|---|
| 2025 | $33,493 | $3,078,056 | $400,000 | $2,678,056 |
| 2024 | $33,493 | $3,078,056 | $400,000 | $2,678,056 |
| 2023 | $35,397 | $2,407,195 | $400,000 | $2,007,195 |
| 2022 | $38,089 | $2,115,543 | $300,000 | $1,815,543 |
| 2021 | $36,594 | $1,605,000 | $300,000 | $1,305,000 |
| 2020 | $36,893 | $1,605,000 | $300,000 | $1,305,000 |
| 2019 | $41,162 | $1,699,871 | $300,000 | $1,399,871 |
| 2018 | $26,453 | $1,149,102 | $300,000 | $849,102 |
| 2017 | $27,414 | $1,106,020 | $300,000 | $806,020 |
| 2016 | $25,280 | $1,019,905 | $300,000 | $719,905 |
| 2015 | $24,868 | $300,000 | $300,000 | $0 |
| 2014 | $24,868 | $1,642,000 | $300,000 | $1,342,000 |
Source: Public Records
Map
Nearby Homes
- 912 Berkshire Rd
- 914 Turnberry Ln
- 1275 Shady Oaks Dr
- 810 Brazos Dr
- 1285 Shady Oaks Dr
- 1402 Thetford Ct
- 1425 N Peytonville Ave
- 403 Presidio Ct
- 1101 Linnea Ln
- 501 Fox Glen
- 300 Shady Oaks Dr
- 1805 Leeds Dr
- 550 N Peytonville Ave
- 106 Ascot Dr
- 204 Southridge Lakes Pkwy
- 711 Saratoga Dr
- 1900 Shady Oaks Dr
- 1161 La Mirada
- 1371 Holland Hill
- 903 San Saba Dr
- 1009 Whittington Place
- 1001 Whittington Place
- 1004 Tennyson Dr
- 1004 Whittington Place
- 1008 Tennyson Dr
- 1000 Tennyson Dr
- 1013 Whittington Place
- 1000 Whittington Place
- 1012 Whittington Place
- 1012 Tennyson Dr
- 921 Lexington Terrace
- 1017 Whittington Place
- 1005 Tennyson Dr
- 921 Lexington Terrace
- 804 Brighton Ave
- 1001 Lexington Terrace
- 1016 Whittington Place
- 917 Lexington Terrace
- 917 Lexington Terrace
- 1009 Tennyson Dr